The Residual
A futile attempt to try and calculate landlord profits

Three companies own nearly every commercial theatre on Broadway and not one of them has ever printed what it makes. Well…almost never.
There’s exactly one audited landlord P&L in public. When ATG bought Jujamcyn, British disclosure rules required it to do something no American regulator has ever asked any theatre company to do, nor really most private companies; print its profit. According to Philip Boroff, ATG raked in $34 million of profit on $116 million of revenue across five theatres for the fiscal year ending March 30, 2024. Twenty-nine cents on the dollar, against twelve for the S&P 500. A landmarked building on forty-fifth with a mouse problem cleared more than twice the margin of the entire American stock market, and I’ve stopped taking it personally.
A normal person would read that fact once, maybe text about it in their group chat, and get on with their life. Instead, I figured “well, 12% of the answer key to what theater owners make is within this spread. If I know what five of them clear, and I know how many people came through the doors of the other 28 commercial theaters, how hard can it be to work backward to a rate and then forward again?” Right? Right?
Of course I HAD to make a model based off this filing. Its built out of things anyone can pull; A concession contract filed as an exhibit in a lawsuit, a tax memorandum written to instruct city auditors, utility filings, the City’s current assessment roll, queried building by building, by address.
The idea took 4 minutes. Checking it, well, that took about a month and a half.
One season. Thirty-three buildings. Three companies.
$177 million in profit.
Theatre-aficionados, Shubert executives who have already scrolled to the bottom to find the mistake, and LinkedIn users who will ambiguously throw shade at me on their feed: this is an estimate. However, every guesstimated line item pushes the same direction. Read everything that follows as a floor.
HOW A LANDLORD GETS PAID
ONE, PERCENTAGE RENT
$91.7M TOTAL.
Shubert $37.6M, Nederlander $34.7M, ATG $19.4M.
The owner takes a slice off the top of the box office before the production has paid a single dollar to anyone else. 5-7% is the standard. However, on net receipts, not the grosses published in BroadwayWorld or the league’s website. Out of the gross come the facility fee (more on that later), credit card fees, group sales, and remote commissions. All in all, totaling about 6% of the total fee.
Let’s assume 6% x .94 x total gross. When you run this week by week for all 55 productions, across 1,369 weeks, accounting for dark days, you end up with… well, the headline number: $91.7 million in percentage rent paid to the theater owners. At a hyper conservative level, where every deal on Broadway is at 5%, the total is $76.4 million, still a pretty large number for only 1 out of 5 of your revenue streams. For the paranoid / anyone who believes every landlord negotiated like a landlord, 7% gets you $107.0 million. A $30 million difference between the high and low end.
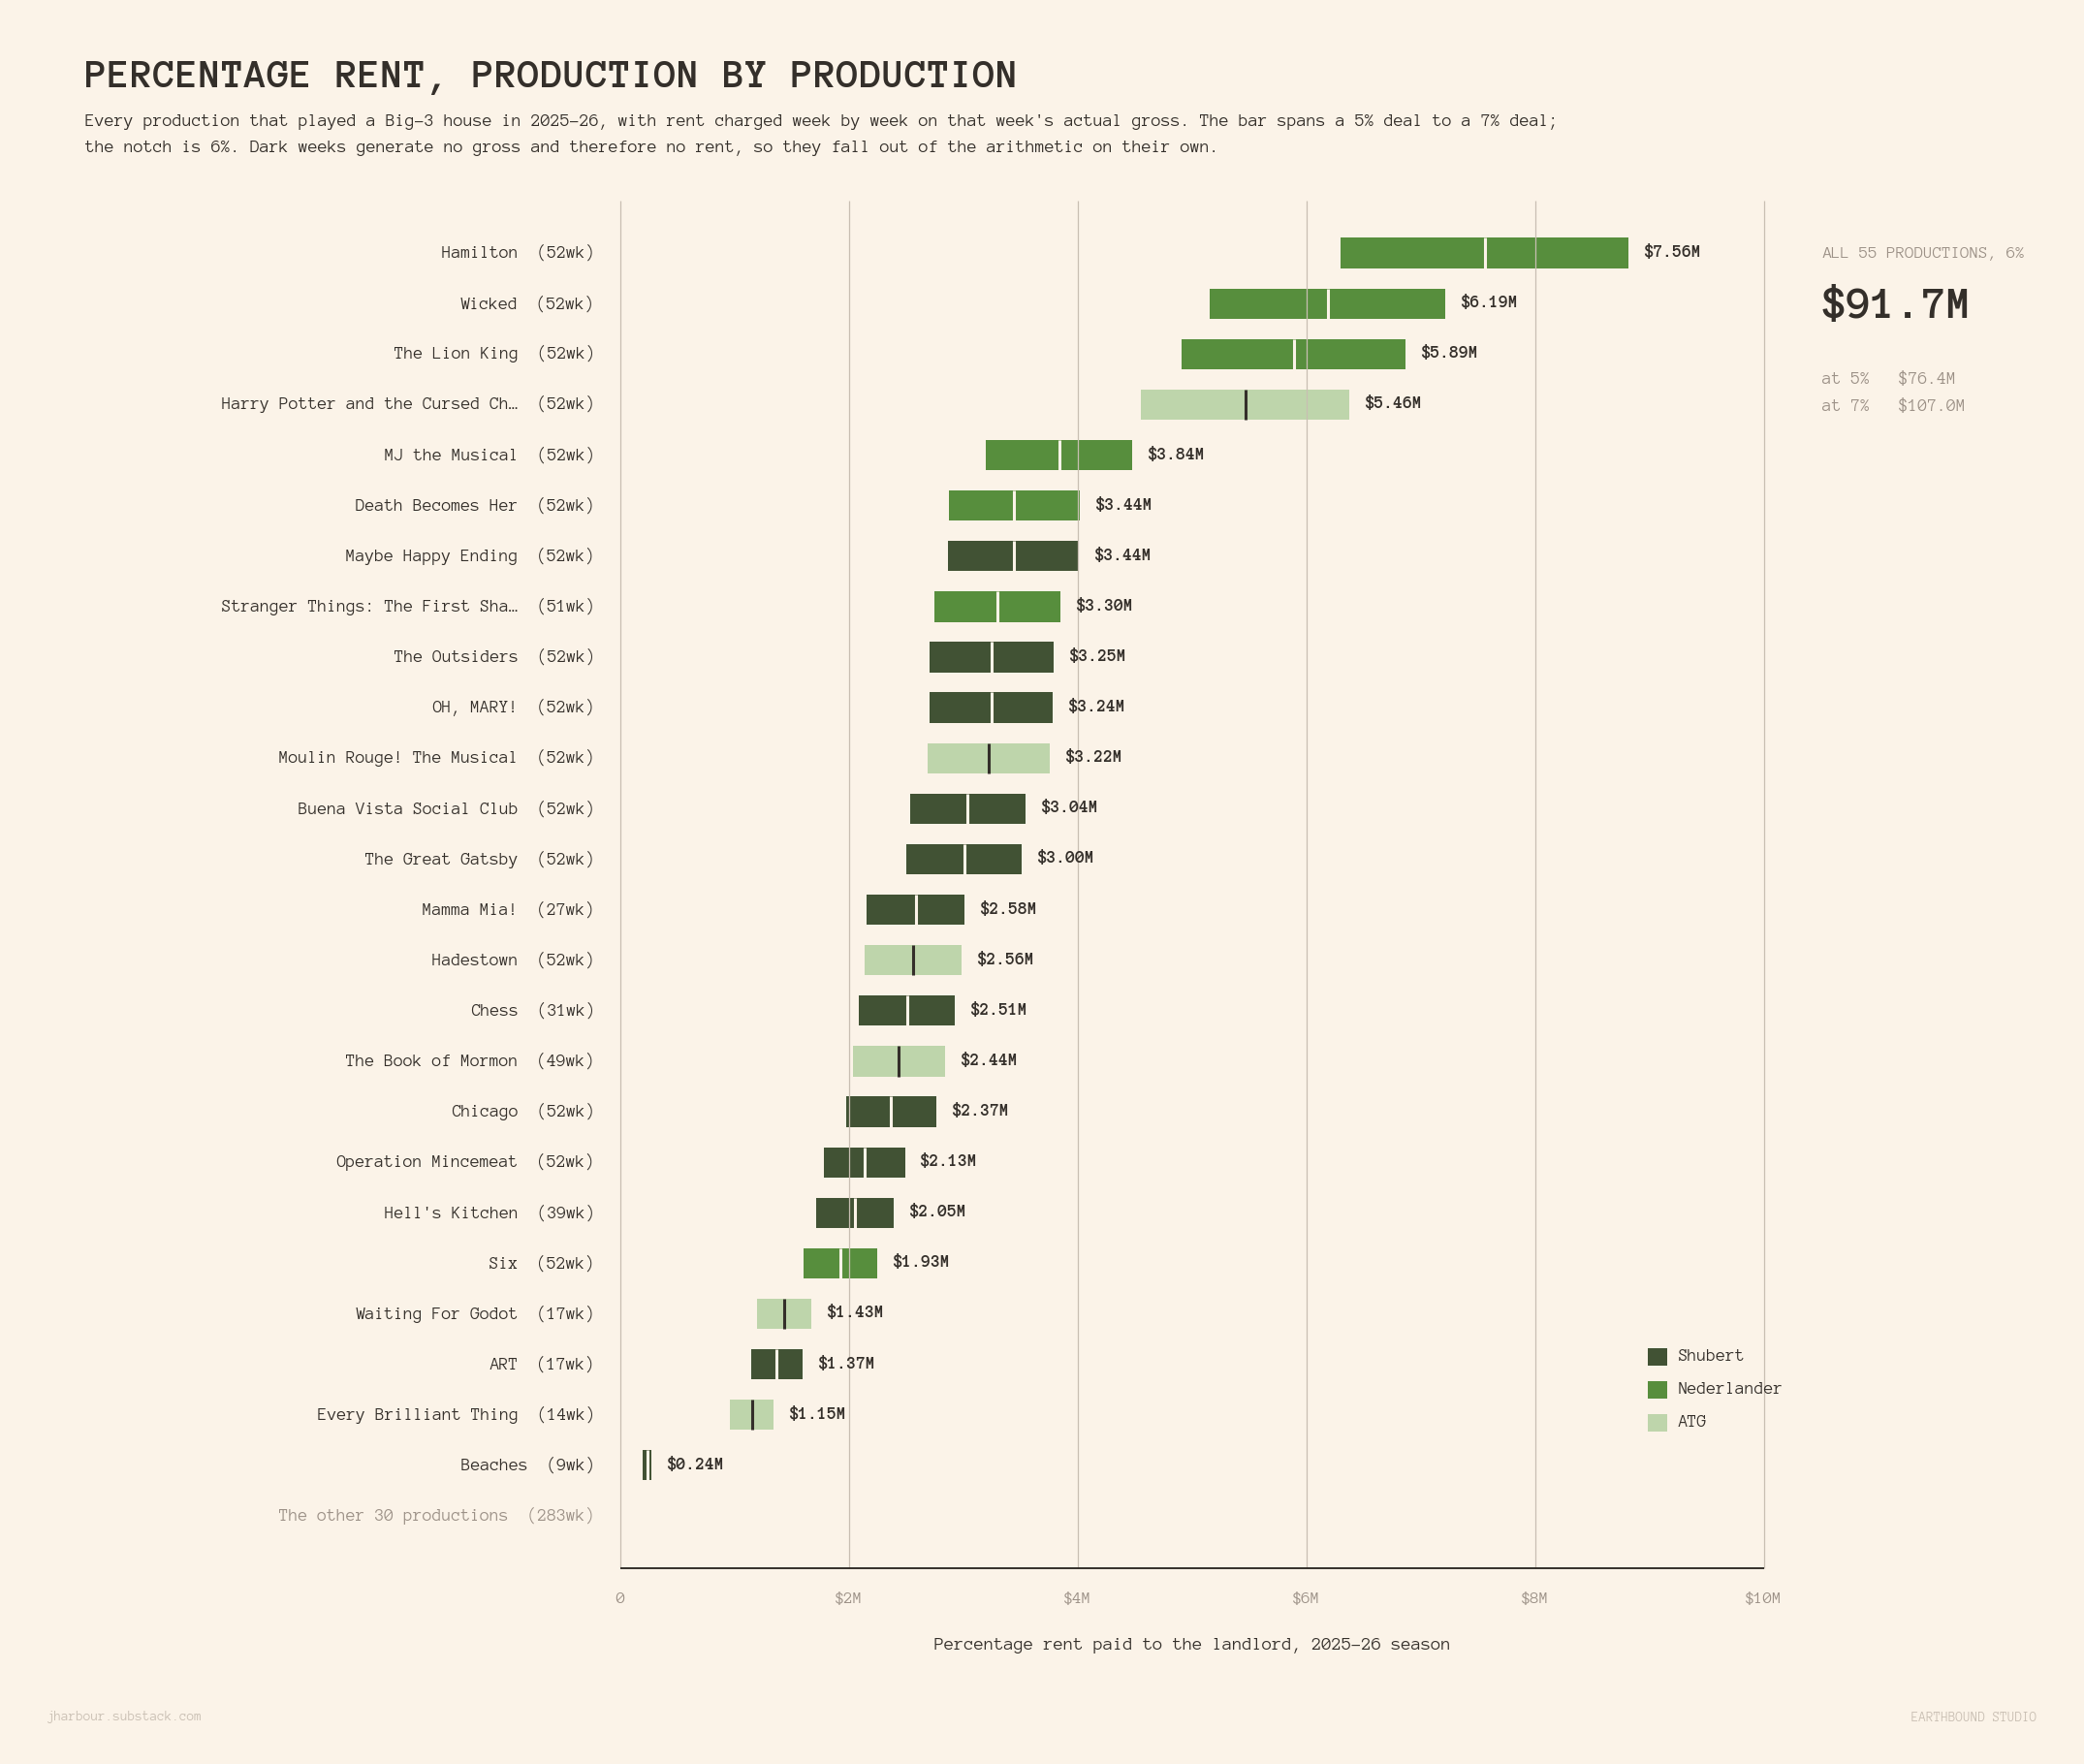
Sure, theater-rental rates are negotiated on a show-by-show basis, and I do not have access to any of actual contracts between the theater owners and producers. Moreover, shows like Wicked and Chicago, that have been in their theaters for decades, might have leverage over their percentage compared to a new musical, while a limited run play with a sixteen-week window and a star with a hard out is negotiating from the opposite side of the table. Logic says that in the end, it all washes out; the ancient lease and the desperate new one, I believe it the way you believe a stranger’s alibi at 4AM on a Sunday morning when locked out of your apartment and needing to spend the night somewhere until the locksmith store opens up: mostly, because it’s four in the morning and the locksmith doesn’t open till nine.
TWO, THE HOUSE CHARGE
$20.5M Total.
Shubert $9.9M, Nederlander $6.2M, ATG $4.4M.
A flat weekly payment, on top of the percentage rent, owed for every week the production occupies the building.
Ken Davenport claims this number tends to be about $10,000 a week depending on house size, while Hustle estimated closer to 20,1 I’ve heard bigger. And truthfully, Davenport’s claim is ten years old, and a decade ago in America was a foreign currency. So, I put it at $15,000 and then multiplied that by the number of playing weeks from last season (1,369). The result: $20.5M.2
While the math treats a show like Wicked and a show like Oh Mary! as identical in terms of its rental rate — both are in massively different-sized venues (1,933 v. 922)— I think it’s rational to assume that the extremes roughly average out. Long-running tenancies also typically have annual bumps written in. Chicago has been at the Ambassador since the Bush administration. Whatever it’s paying, it isn’t the same amount it signed for.
$20.5 million is only 22% of the $91.7 million collected in percentage rent, yet it is the one number on this list that is truly independent of the success of the show.
THREE, BARS, CONCESSIONS
$43.1M TOTAL
Shubert $15.2M, Nederlander $17.4M, ATG $10.5M.
In November 2023 Sweet Hospitality Group sued Jujamcyn to stop ATG from throwing it out of five buildings, and the Concession Management Agreement went into the court file as Exhibit 1.
47.5% of Net Sales on all food and beverage, plus 20% of catered beverage and 10% of catered food. Interestingly, the contract also guaranteed Jujamcyn a floor; an Average Per-Cap of $1.60 of Net Sales per head, every month, whether anybody drank or not. Per ¶27, Sweet paid Jujamcyn almost $50 million in commissions since the inception of the relationship, which ¶2 dates to 2010.
$50 million against the 23,183,819 admissions those five houses did between January 2010 and the day the complaint was filed: $2.16 a head in straight profit to the landlord. From this, we can assume the average patron was buying about $4.54 of food and drink.3 Weight that window by attendance and it centers on mid-2016, which means I am pricing a 2026 cocktail with a decade of cheaper ones mixed in.4 Run it forward on the consumer price index5 and the per customer spend is $6.13 and the commission is $2.91.
From a purely economic perspective, it’s obvious why ATG terminated this contract. In an in-house model, the owner keeps everything left after product and bar labor. At 65% on that $6.13 basket, assuming costs taken on by the landlord, you are left with $3.98 a head, an additional $1.07 / customer compared to a commission model. A 37% increase for pouring the identical drink to the identical customer.
That distinction matters, because it isn’t the same across the street. Nederlander pours its own, through a subsidiary called Sandbar Concessions. ATG has poured its own since it finished pushing Sweet out in March 2024. The Shuberts, is run by Theatre Refreshment Co. of NY and I cannot confirm whether it is in house or not, so Shubert gets the commission rate of $2.91; and if it turns out Shubert is in-house too, that line goes up by five and a half million dollars and I was wrong in the landlords’ favor again.
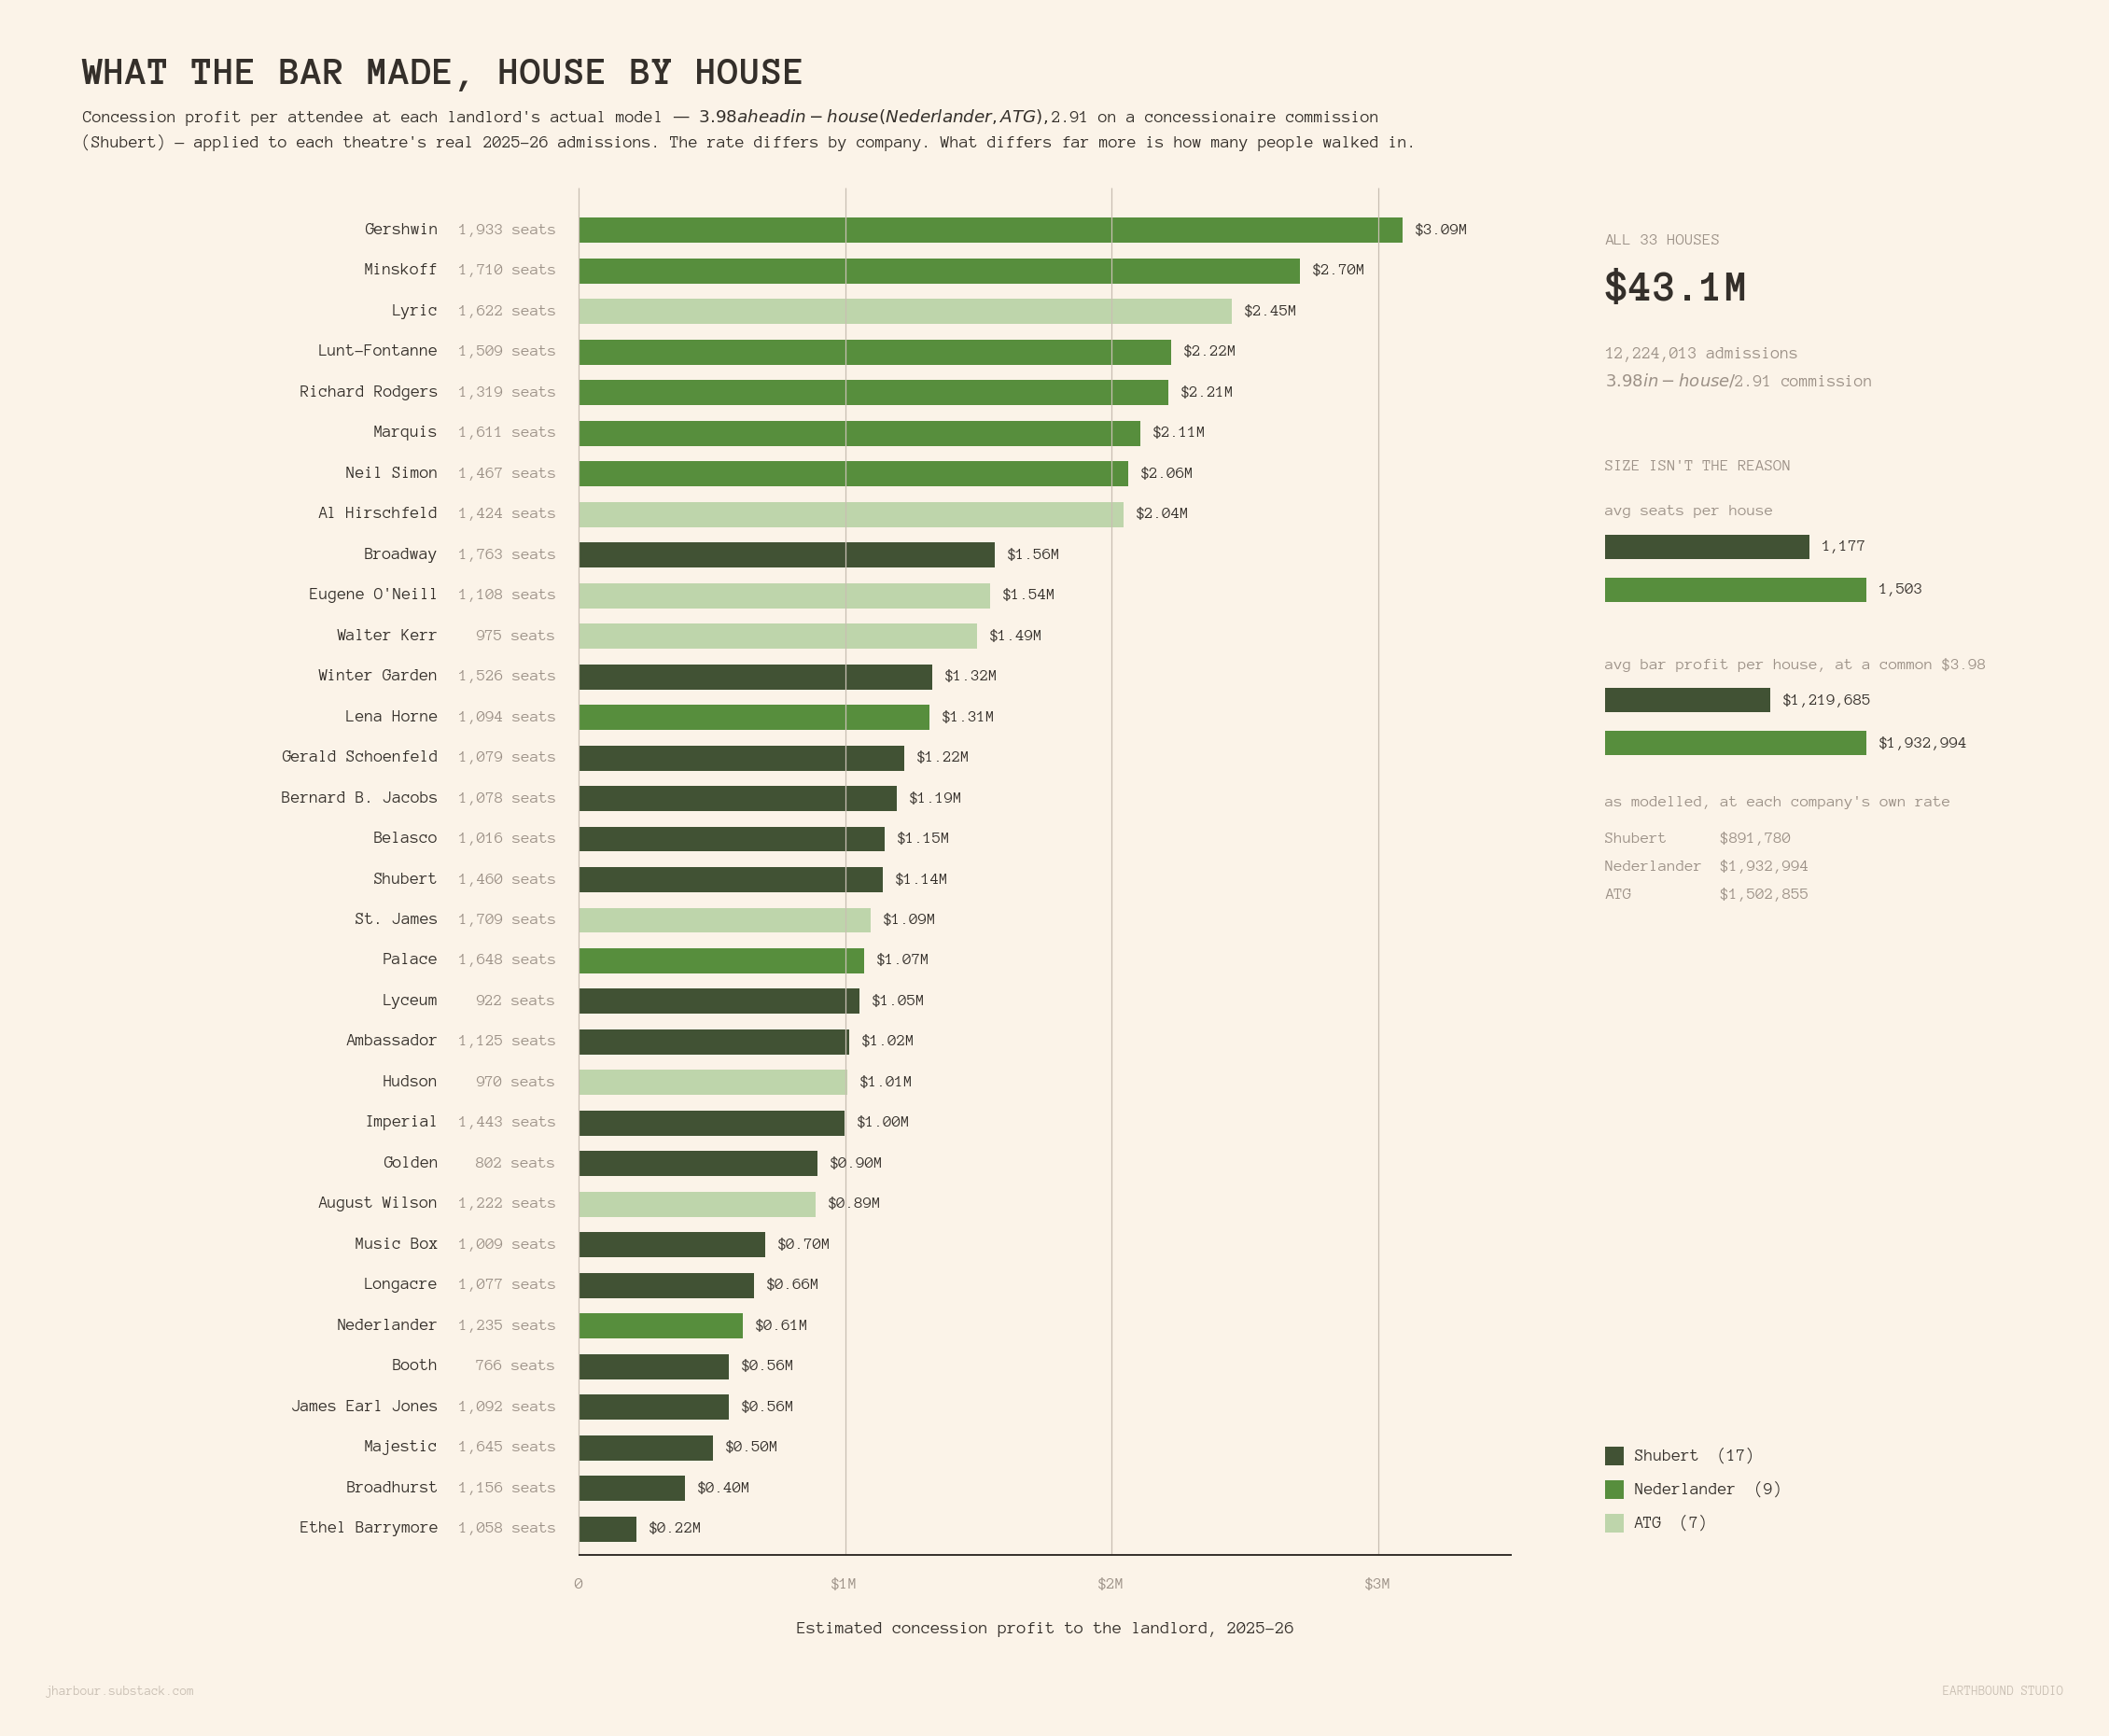
The average Broadway house moved about 370,000 patrons through its doors last season. Nederlander’s nine buildings averaged $1.93 million at the bar. Shubert’s seventeen averaged $892,000.
Averages lie, though, and this one can lie badly.
The Gershwin ran Wicked 52 weeks to 776,396 people, so it poured $3.09 million straight into Nederlander’s pockets. Minskoff, $2.70M; Lyric, $2.45M.
Then there’s the Barrymore: 74,763 tickets to Othello and Joe Turner’s Come and Gone, $217,560. The Majestic, where the final remnants of Gypsy and the nine-week run of Beaches played, $503,191. Same city, same twenty-two-dollar cocktail in the same souvenir cup with the show’s logo on it. A fraction of the money, because a bar in a dark theatre is just furniture.
And the seventeen-versus-nine gap survives even after you strip out the rate difference. Hold both companies at the same $3.98 and Shubert averages $1.22 million a room to Nederlander’s $1.93 million. Eight fewer rooms, fifty-eight percent more money per room. Seat count won’t explain it either: Nederlander averages 1,503 seats a venue to Shubert’s 1,177, 28% bigger, against a 58% gap. The number of theaters owned is inconsequential to a bigger bar. How many people are standing in one is the whole thing, and I’ll come back to why.
FOUR, THE FACILITY FEE
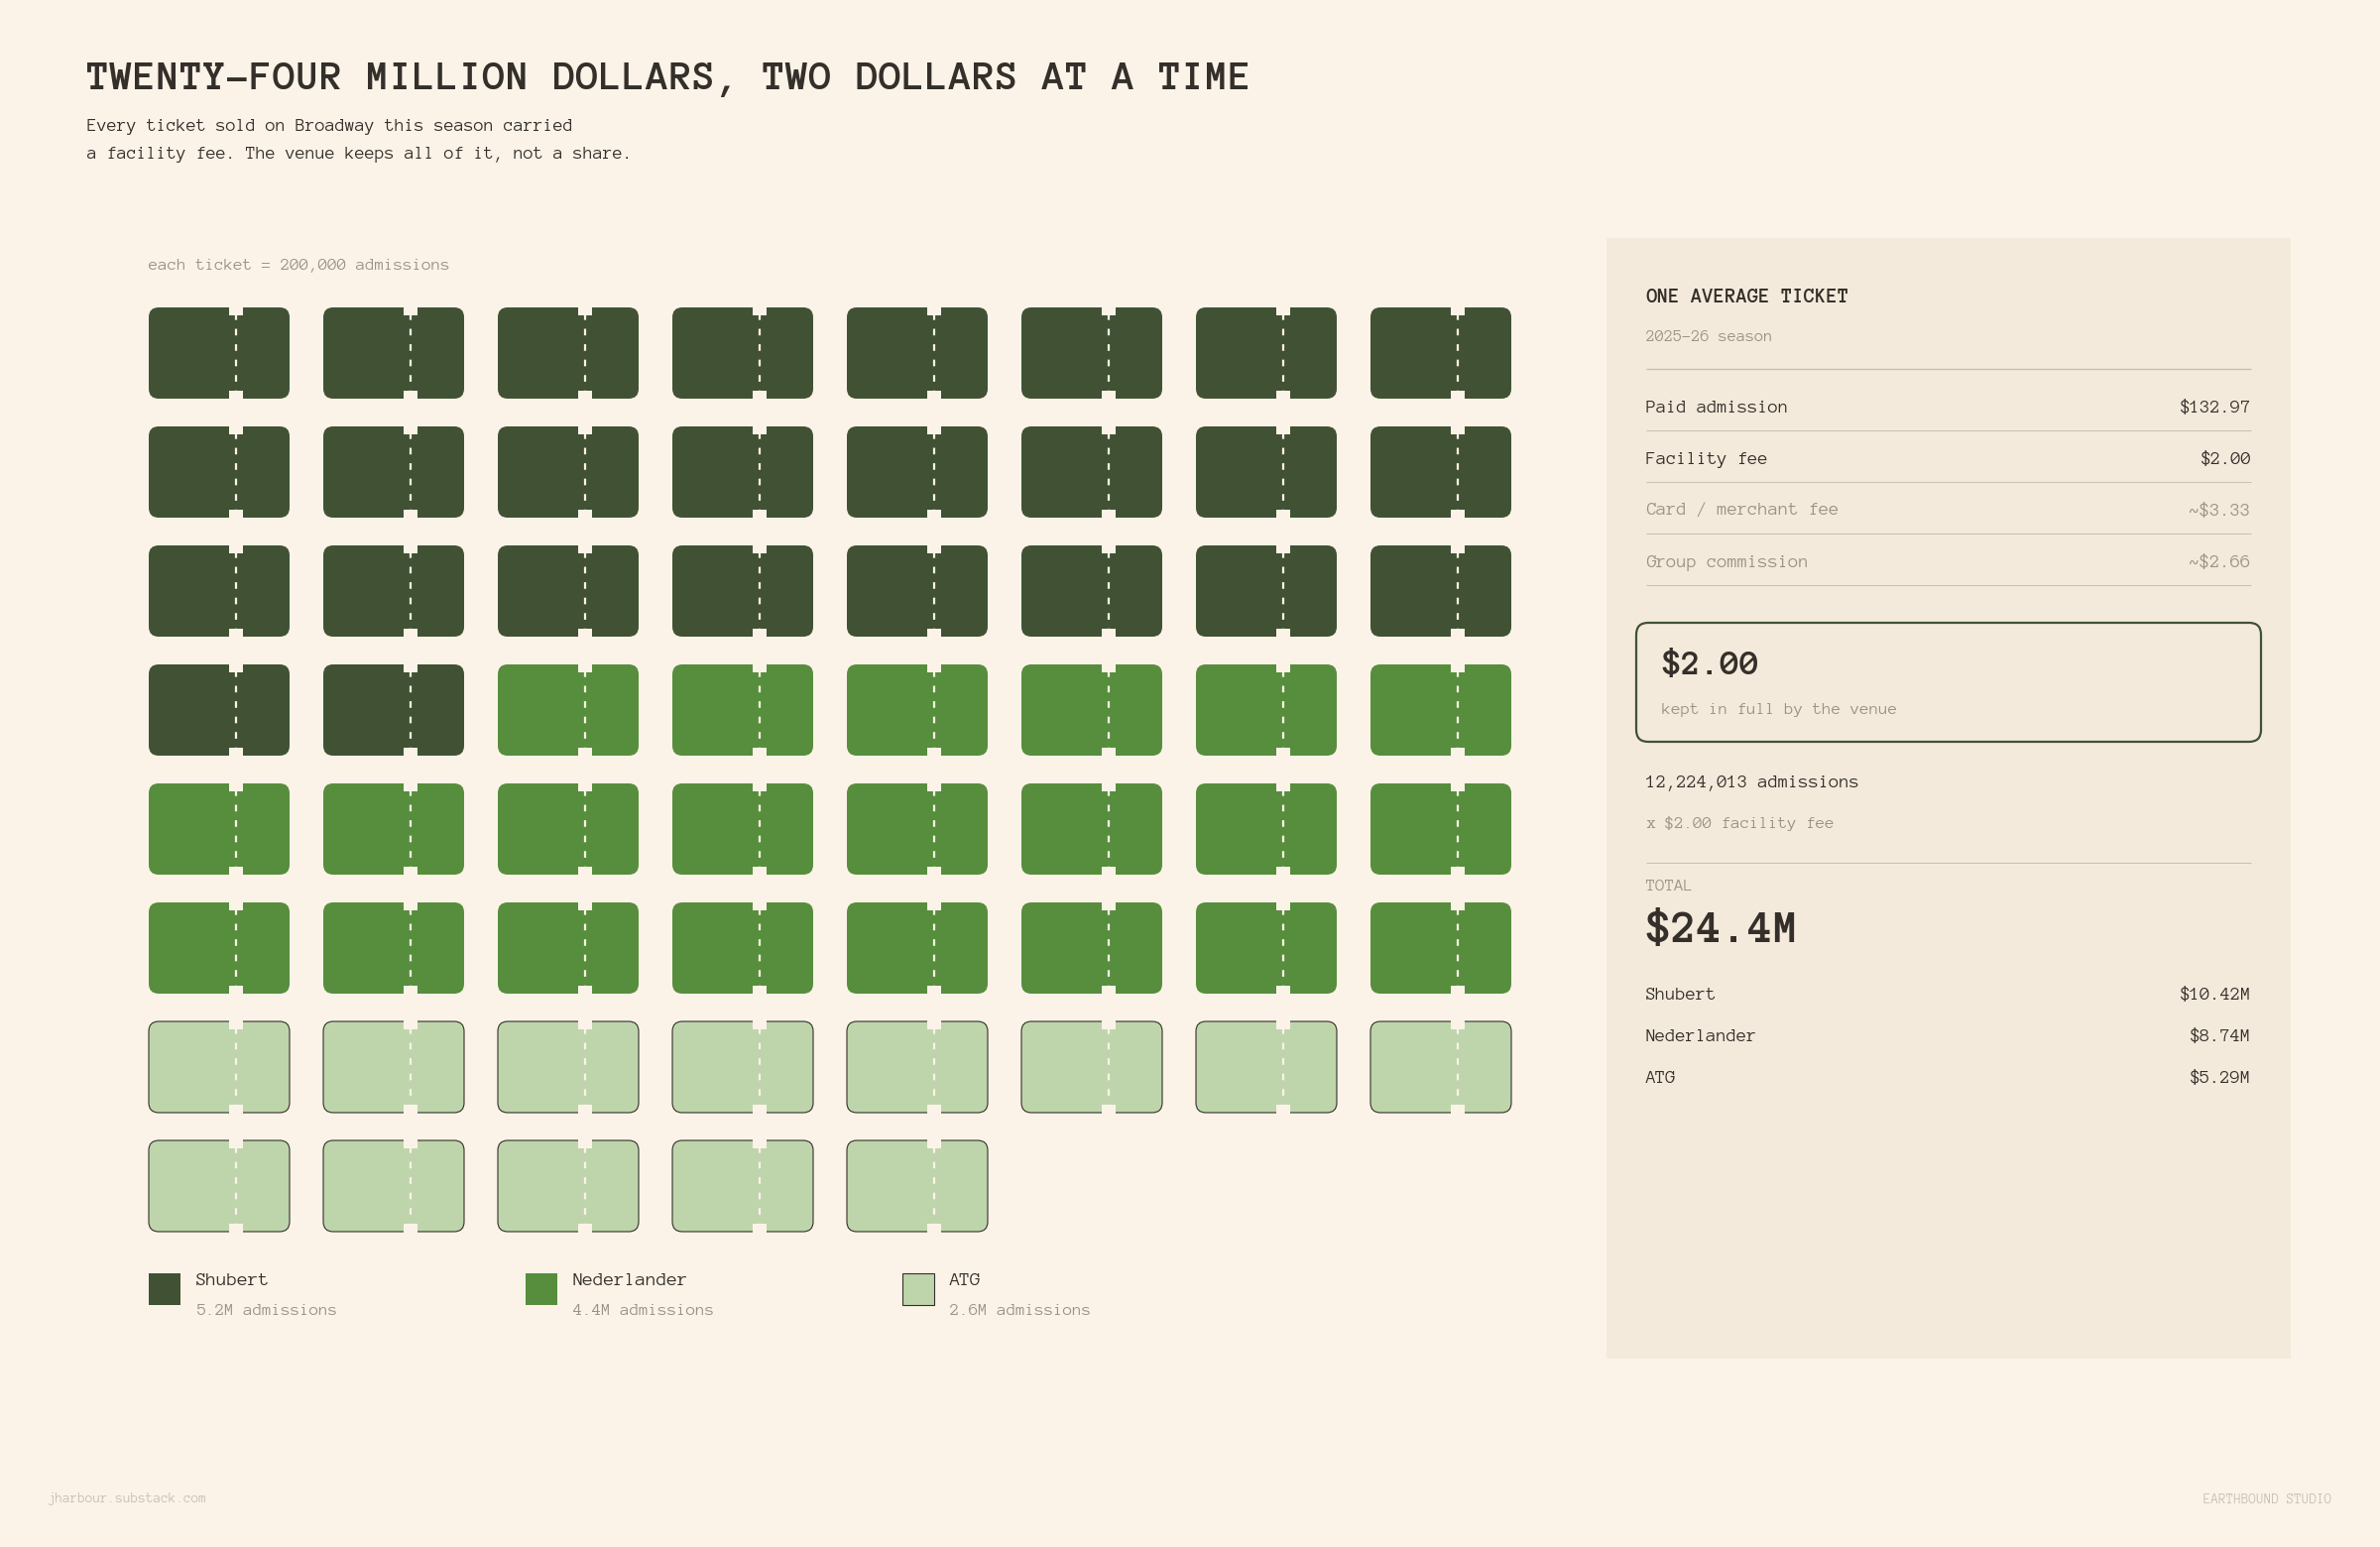
$24.4M.
Shubert $10.4M, Nederlander $8.7M, ATG $5.3M.
This one requires no estimation; it is printed on your receipt, and it is the purest object in the entire structure. In 1997 Jujamcyn attached a one-dollar “restoration fee” to tickets for the Sound of Music revival, restoring … literally fuck all.
The directors’ union has been arbitrating about it ever since.
Twenty-nine years later it is now two dollars, on nearly every ticket sold on this street, and it moves $24.4 million a season to three private companies on the strength of a justification nobody has been required to defend since Clinton’s second term (I’m very into political figures from the 90s lately, if you could not tell). Two dollars a ticket. The venue keeps all of it. Yes, all of it.
No fee, once invented, has ever been uninvented. Go looking.
FIVE, THE TOLL BOOTH
$53.3M.
Shubert $25.9M, Nederlander $17.7M, ATG $9.7M.
Sit with a producer, or scroll past any actor’s TikTok rant, and you’ll hear the same complaint on loop: tickets cost too much. But the long reddit posts and man-on-the-street style talk shows all miss one key aspect; the charges stacked underneath. On top of the cost of your seat, you’re paying a cover charge to get through the door, to the company that is already receiving income for housing the production in its own building. Shubert has Telecharge. Nederlander spent $22 million on a ticketing startup called TixTrack in August 2022, fired Ticketmaster the following year, and rebuilt the whole operation as Broadway Direct. ATG walked all seven of its houses onto ATG Tickets, leaving little ol’ Ticketmaster with just Disney’s New Amsterdam, presumably because nobody wanted to be the one to tell the mouse no.
And the fees aren’t even consistent, which is the funniest part of this whole joke. In 2023 somebody at BroadwayWorld did the only sane thing a journalist can do, price the exact same seats across every platform. Center orchestra, Six, one specific performance. Broadway Direct: $14.50 in fees. Telecharge, same seats, same night: $16.50. Two bucks more, because the theatre changed and the algorithm decided you could take it. Telecharge charges more in Nederlander’s houses than Broadway Direct does, and Broadway Direct charges more in Shubert’s houses than Telecharge does. Two ticketing platforms circling each other like dogs, sniffing, pricing against a competitor neither of them needs to beat because you have no third option.
So here’s the math:
Shubert. 5,209,709 admissions from its own houses, plus 1,605,061 more from the seven nonprofit and independent Broadway theatres it ticket s— everything on the street that isn’t owned by the three and isn’t the New Amsterdam — = 6,814,770 tickets.
At $13.50 a ticket in service fees, plus $1.11 more in per-order handling spread across an average cart of 2.7 tickets, and assuming 65% of those tickets actually carry a fee (more on that “assuming” in a second) you get $64.7 million of fee revenue. Take 40% of that as operating profit, which is roughly where Ticketmaster’s own reporting puts this kind of business, and Shubert clears $25.9 million in pure profit from selling you the right to buy a seat.
Nederlander. 4,371,091 admissions, $14.50 a ticket, same 65/40 assumptions, $17.7 million.
ATG. 2,643,213 admissions, $13.00 a ticket, $9.7 million.
Yes, an enormous chunk of Broadway’s audience does not actually pay that service fee. There are a series of channels ranging from the TKTS Booth, digital lotteries, rush, comps, and group buys that all decrease the actual estimate.6
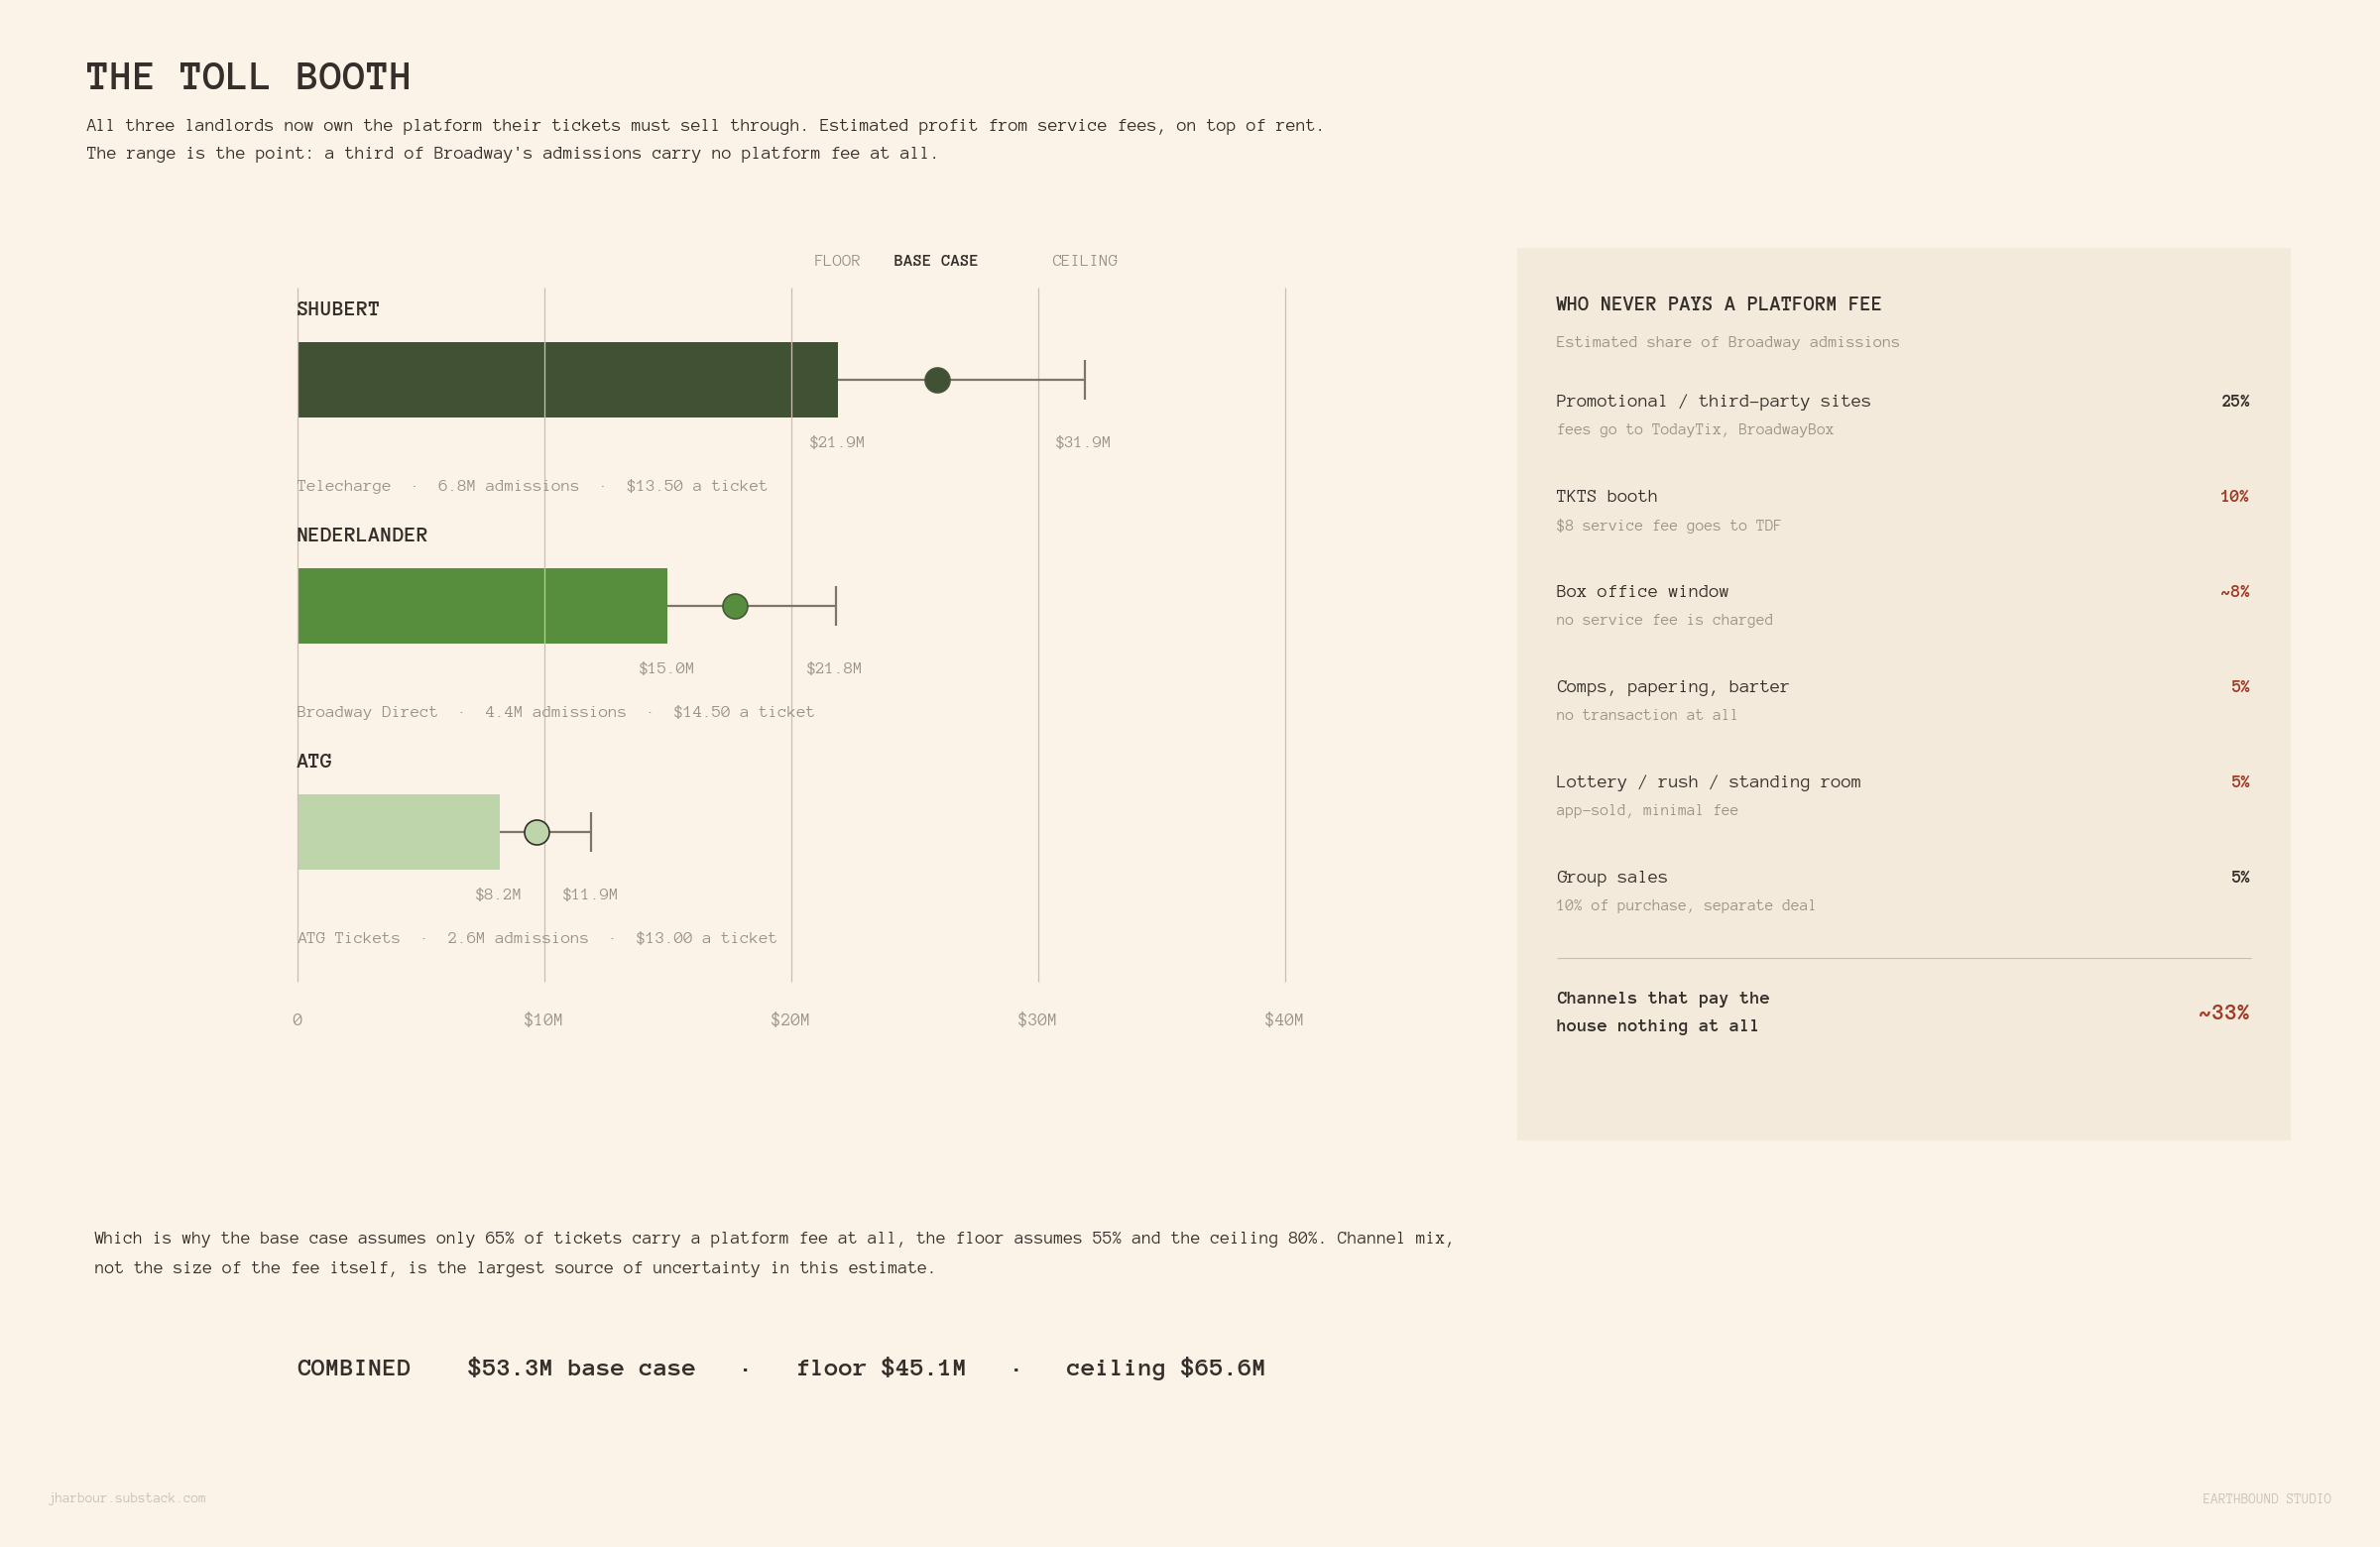
Stack all that up and you’re looking at a third of every ticket sold on Broadway generating zero platform revenue. Hence why the base case assumes 65%. Move it to 55% and the combined total drops to $45.1 million. Move it to 80% and it rockets to $65.6 million. Channel mix, not the size of the fee, is the largest single source of uncertainty in this whole piece.
SIX, CO-PRODUCING AND WHAT I CAN’T COUNT
Of the 72 productions that played Broadway this season, fourteen carried a producing credit from one of the three landlords. Twelve were playing inside a building owned by a company that co-produced them. $433.5 million of gross moved through runs where the landlord was also an investor.
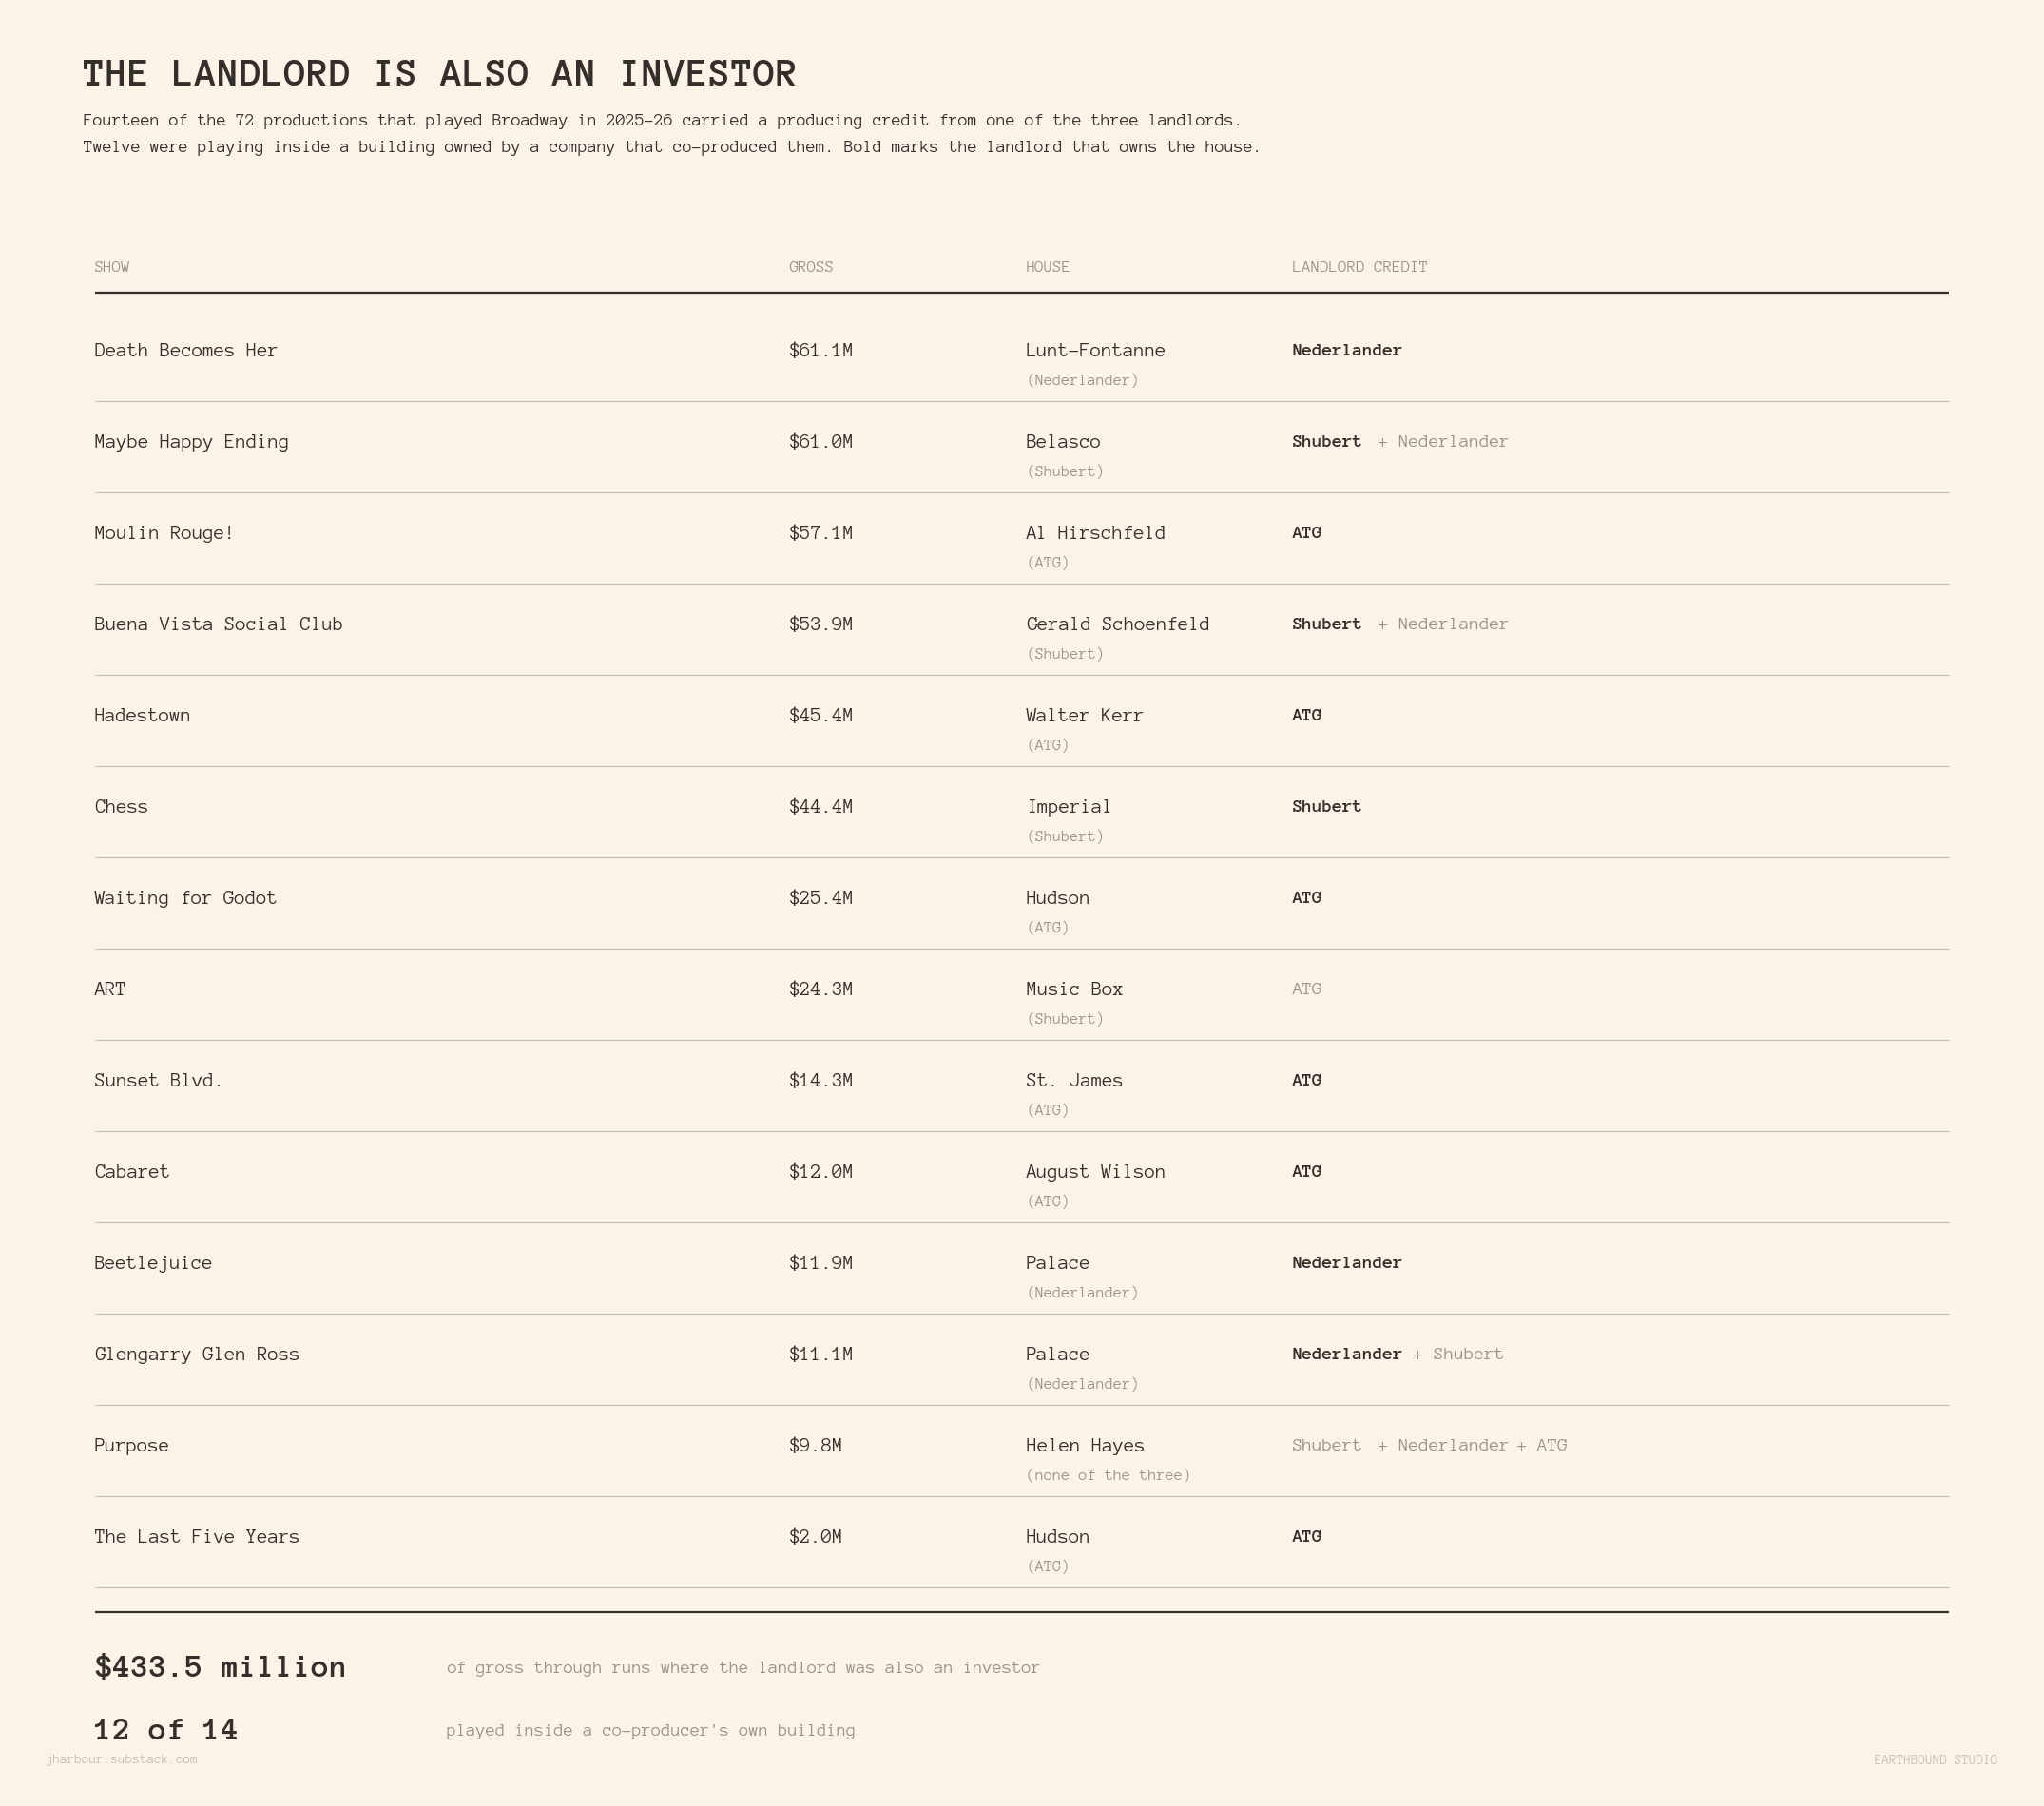
Only two commercial productions recouped this season. ATG co-produced both: Waiting for Godot and ART. Widen the frame to the season before and it holds; Glengarry Glen Ross recouped its $7.5 million capitalization in nine weeks with James L. Nederlander and Shubert on the billing, and The Outsiders recouped with Shubert and James L. Nederlander credited.
Then there are the annuities. Moulin Rouge! and Hadestown have both been running since 2019, long past recoupment, both credited to the landlord whose building they’re in, both playing all fifty-two weeks.
So, here’s a fun little question to pose, because I don’t think it’s mine to answer: when the same company sets the rent, collects the fee, pours the drinks, sells the ticket, and holds equity in the show, what exactly is the booking calendar optimizing for?
Of course, as I have written about repeatedly, none of this is a guaranteed win. Eight of the fourteen closed before the season ended, three of them inside seventeen weeks.
Without an operating agreement (which no one will share) or a Form D (which I am too lazy to wait 6 months before receiving back my FOIL request… I commend your patience Philip), any number I gave you would be fiction with a decimal point. My honest guess, on the season just ended and in this marketplace, is that the co-production line is a wash and possibly negative, and that these investments are more for the sake of relational upkeep than profit maximizing. Hold onto that guess, though. It stops being safe in about two thousand words, when I go looking for fifteen million dollars I can’t otherwise find.
The rest of what’s missing
Merchandise
Touring and subsidiary rights
Telecharge beyond Broadway
Real estate that isn’t a Broadway theatre
Naming rights and Times Square signage
Premium experiences, VIP lounges and skip-the-line access
Group sales commissions
Every one of these pushes the same direction: up. The cost side is the only thing in this piece that can push back.
COSTS
Sitting on nyc.gov, hidden behind technical language about theater taxation rates that no one will ever read, is a three-page memorandum called Statement of Audit Procedure CRT-2008-02. It is about as exciting as reading a parking regulation. And ironically, it is the single most useful document about the economics of the American theatre that exists in public, because in order to tax a payment the City first has to itemize it — and so a tax examiner in Manhattan, trying to answer a boring question, accidentally published the rate card that nobody in the industry ever openly discusses.
I’m listing in full what the memo says a producer pays a theatre owner, because the list is the whole argument.

Twenty-two ways to bleed the show vs. four to bleed the house. The production pays the landlord’s real estate taxes. It pays the theatre’s Broadway League dues, I pays a fee for using sound and lighting rigs the landlord bought and depreciated during a previous residency. Gear he already told the IRS was worthless, billed weekly, forever. The production even pays to have the roaches killed. The roaches are his, the extermination is yours. So, is the owner really operating a theater, or rather, a billing department attached to a theatre?
Really, the narrower and much more revealing question to ask is: what’s left over that the owner actually eats?
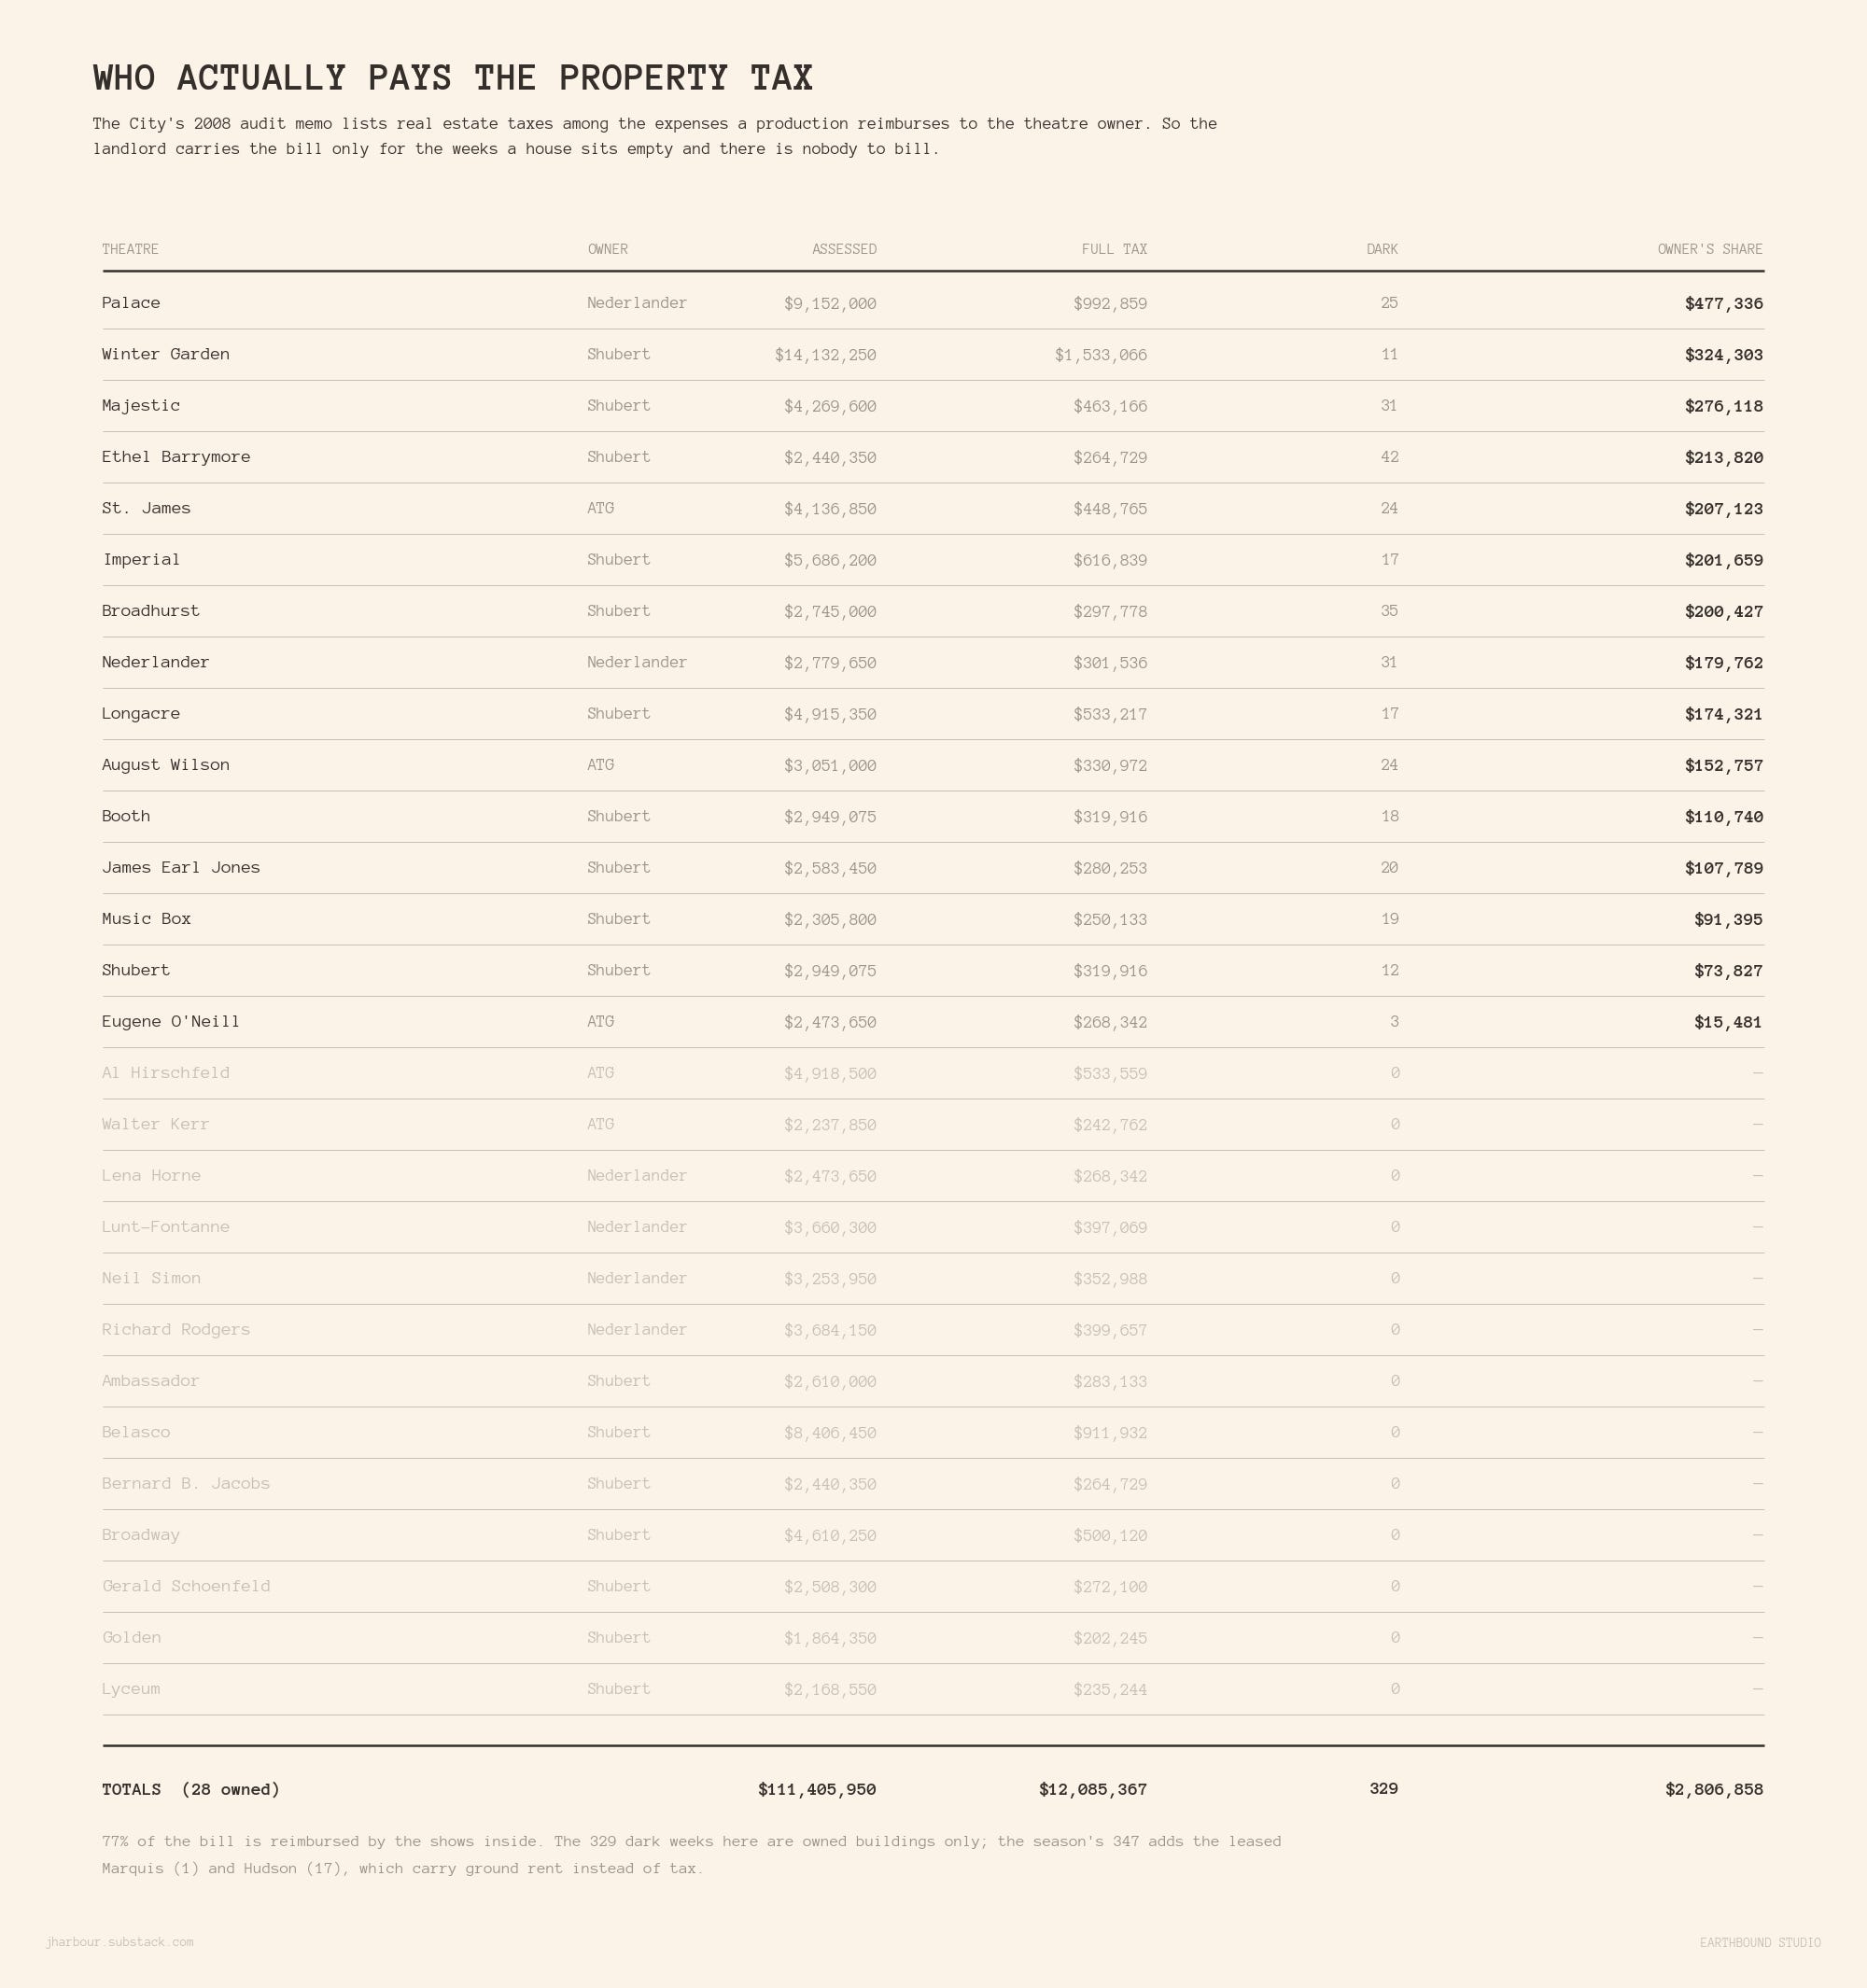
Property tax for dark weeks.
Shubert: $1.8M of a $7.5M bill
Nederlander: $650k of $2.7M ($470,000 of that is the Palace alone)
ATG: $375,000 of $1.8M
Every owned theatre was queried by address against the City’s FY2026 assessment roll and taxed at the final Class 4 rate the Council adopted last October, 10.848%. $12,085,367 of property tax across the twenty-eight buildings the three companies actually own. WITH THE SHOWS IN THOSE BUILDINGS REIMBURSING 77% OF THAT PROPERTY BILL.
13 of those 28 buildings had their property taxes completely paid for by the production, because the lights never went off. The owner only carries the bill in proportion to the weeks the house sits empty and there is nobody to bill.
Ground rent
I think it’s safe to assume (based on the fact that they literally pay for everything else) that when a theater owner leases and operates a building instead of owning it, another reimbursable cost is added to the producer’s bill. The Hudson is the only leased theater that had any dark weeks, 17 total between The Last Five Years, Godot, and Every Brilliant Thing.7
Nobody has published what ATG pays Millennium & Copthorne, but the Palace provides a useful touchpoint. Per the City’s own evaluation in 2026, it’s worth is $22,038,000. The City arrives at this number by asking what the property earns in a year and working back from it, using the going rate of of 7.5% for commercial buildings. That’s about $1.65 million a year, and for the Palace, at 1,648 seats, it works out to $1,000 a seat. The Hudson has 970 seats. At the same rate per seat, the building is worth about $996,000 a year or $19,150 a week. Seventeen dark weeks is $326,000.
All in all, it comes to about $326,000 ATG paid for their dark weeks.
Retained staff
Again, the tenant funds just about everything. What the owner carries is what survives between tenancies and above the building: booking, executive, legal, and the engineering staff that keeps a landmark from failing while it’s empty.
I model $350,000 per theatre per year. $11.55 million across all 33.
Building upkeep
The only rigorously documented Broadway capital number in public is the Palace, whose restoration and thirty-foot hydraulic lift was reported at $50 million, with some accounts putting the full restructuring at $80 million. It is also the wrong number for my purposes, as the Palace work was funded by L&L Holding and the TSX Broadway developers as part of a $2.5 billion tower, not by Nederlander out of operating cash. So, I use it as a ceiling on plausibility. Assume roughly $25 million per landmarked house over a thirty-three-year renovation cycle = $750,000/year/building. $24.75 million. The Palace at $50–80 million says that’s conservative for a full gut. The fact that a developer paid for it says that landlords sometimes get these for free.
Corporate overhead
No filing exists that articulates what Shubert or ATG spend on their personnel expenses. But seven public companies that are required to submit yearly public profit statements, are landlords (who, like broadway, have tenants that carry the operating cost) and all of them print their general and administrative expense every year. Median of the seven is 6.3%.8 I model 6.5%.9
On $233.1 million of revenue that’s, ~15 million.
Dark-week carry
Local Law 84 requires every building over 25,000 square feet to report its metered energy use on a monthly. Since every Broadway house is over 25,000 square feet, the Covid shutdown a controlled experiment. Nine houses with clean data averaged 139,600 kBtu of electricity a month with a show inside them. From April 2020 forward they averaged 39,000, or 30% of that. An empty Broadway theatre draws about 2,640 kilowatt-hours a week, which at Con Ed’s commercial rate is roughly $740.
The moment the production leaves, the security line has nobody left to bill, and the owner is paying a guard to watch an empty room, with property tax and other personnel costs covered by the theatre owner. About 13 grand a week all-in.10
Across 347 dark theatre-weeks, $1.35 million. Shubert $0.87M, ATG $0.27M, Nederlander $0.22M.
An answer
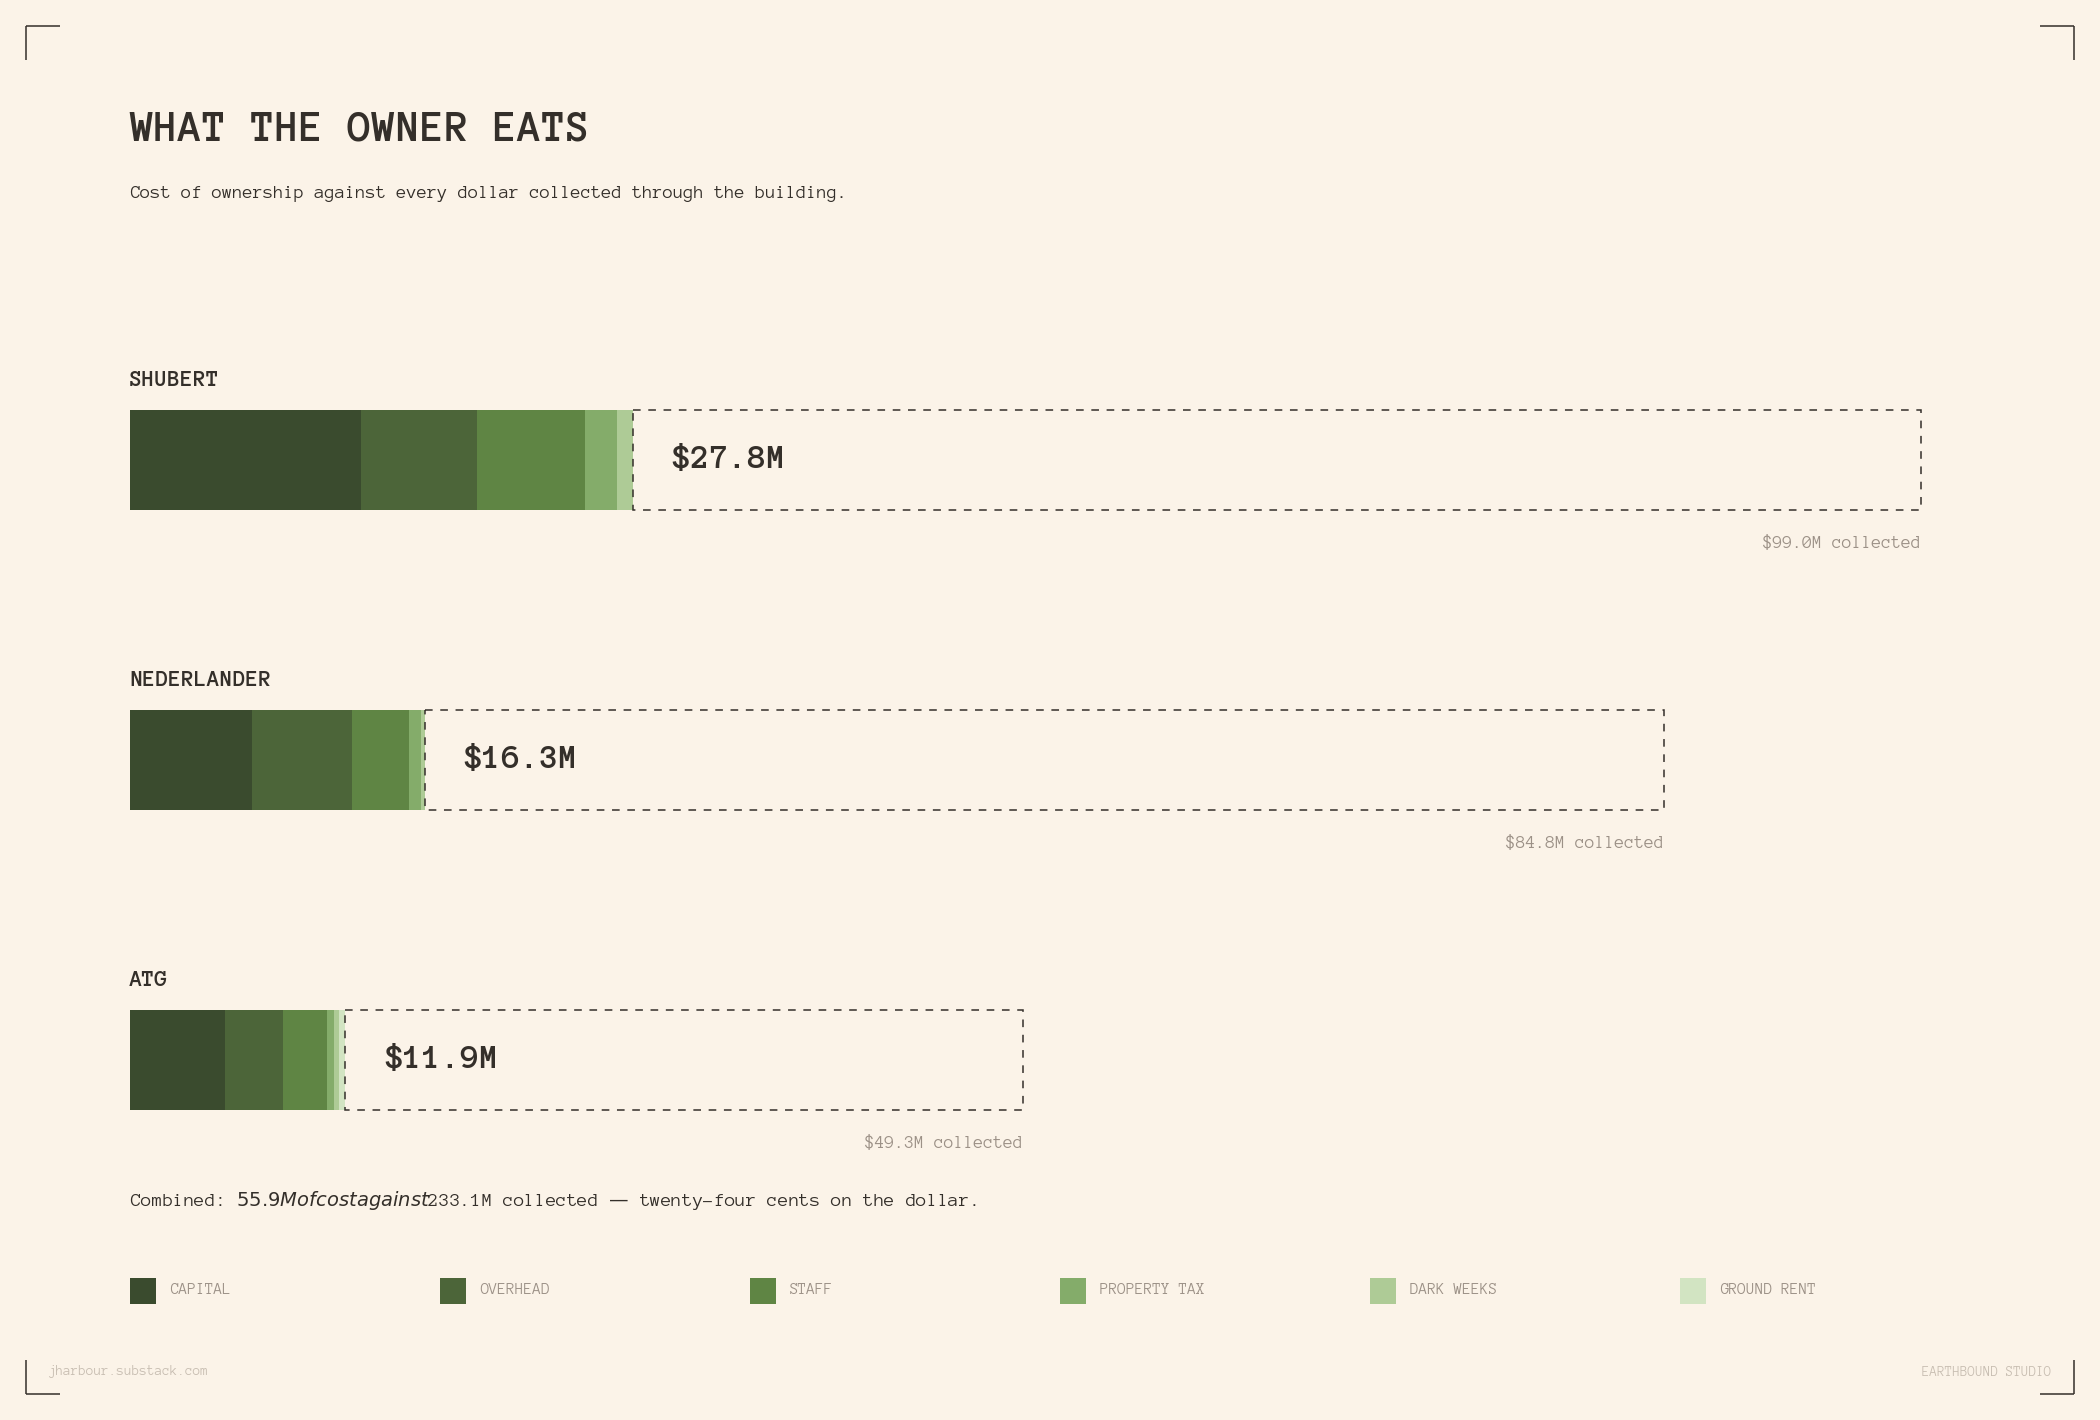
$55.9 million
That is what it costs three companies to own and operate thirty-three Broadway theatres for a year. Against $233.1 million of revenue collected through them. Twenty-four cents on the dollar. The rest is the building doing what buildings on Forty-Fifth Street do…. sit there.
And the profit margin?
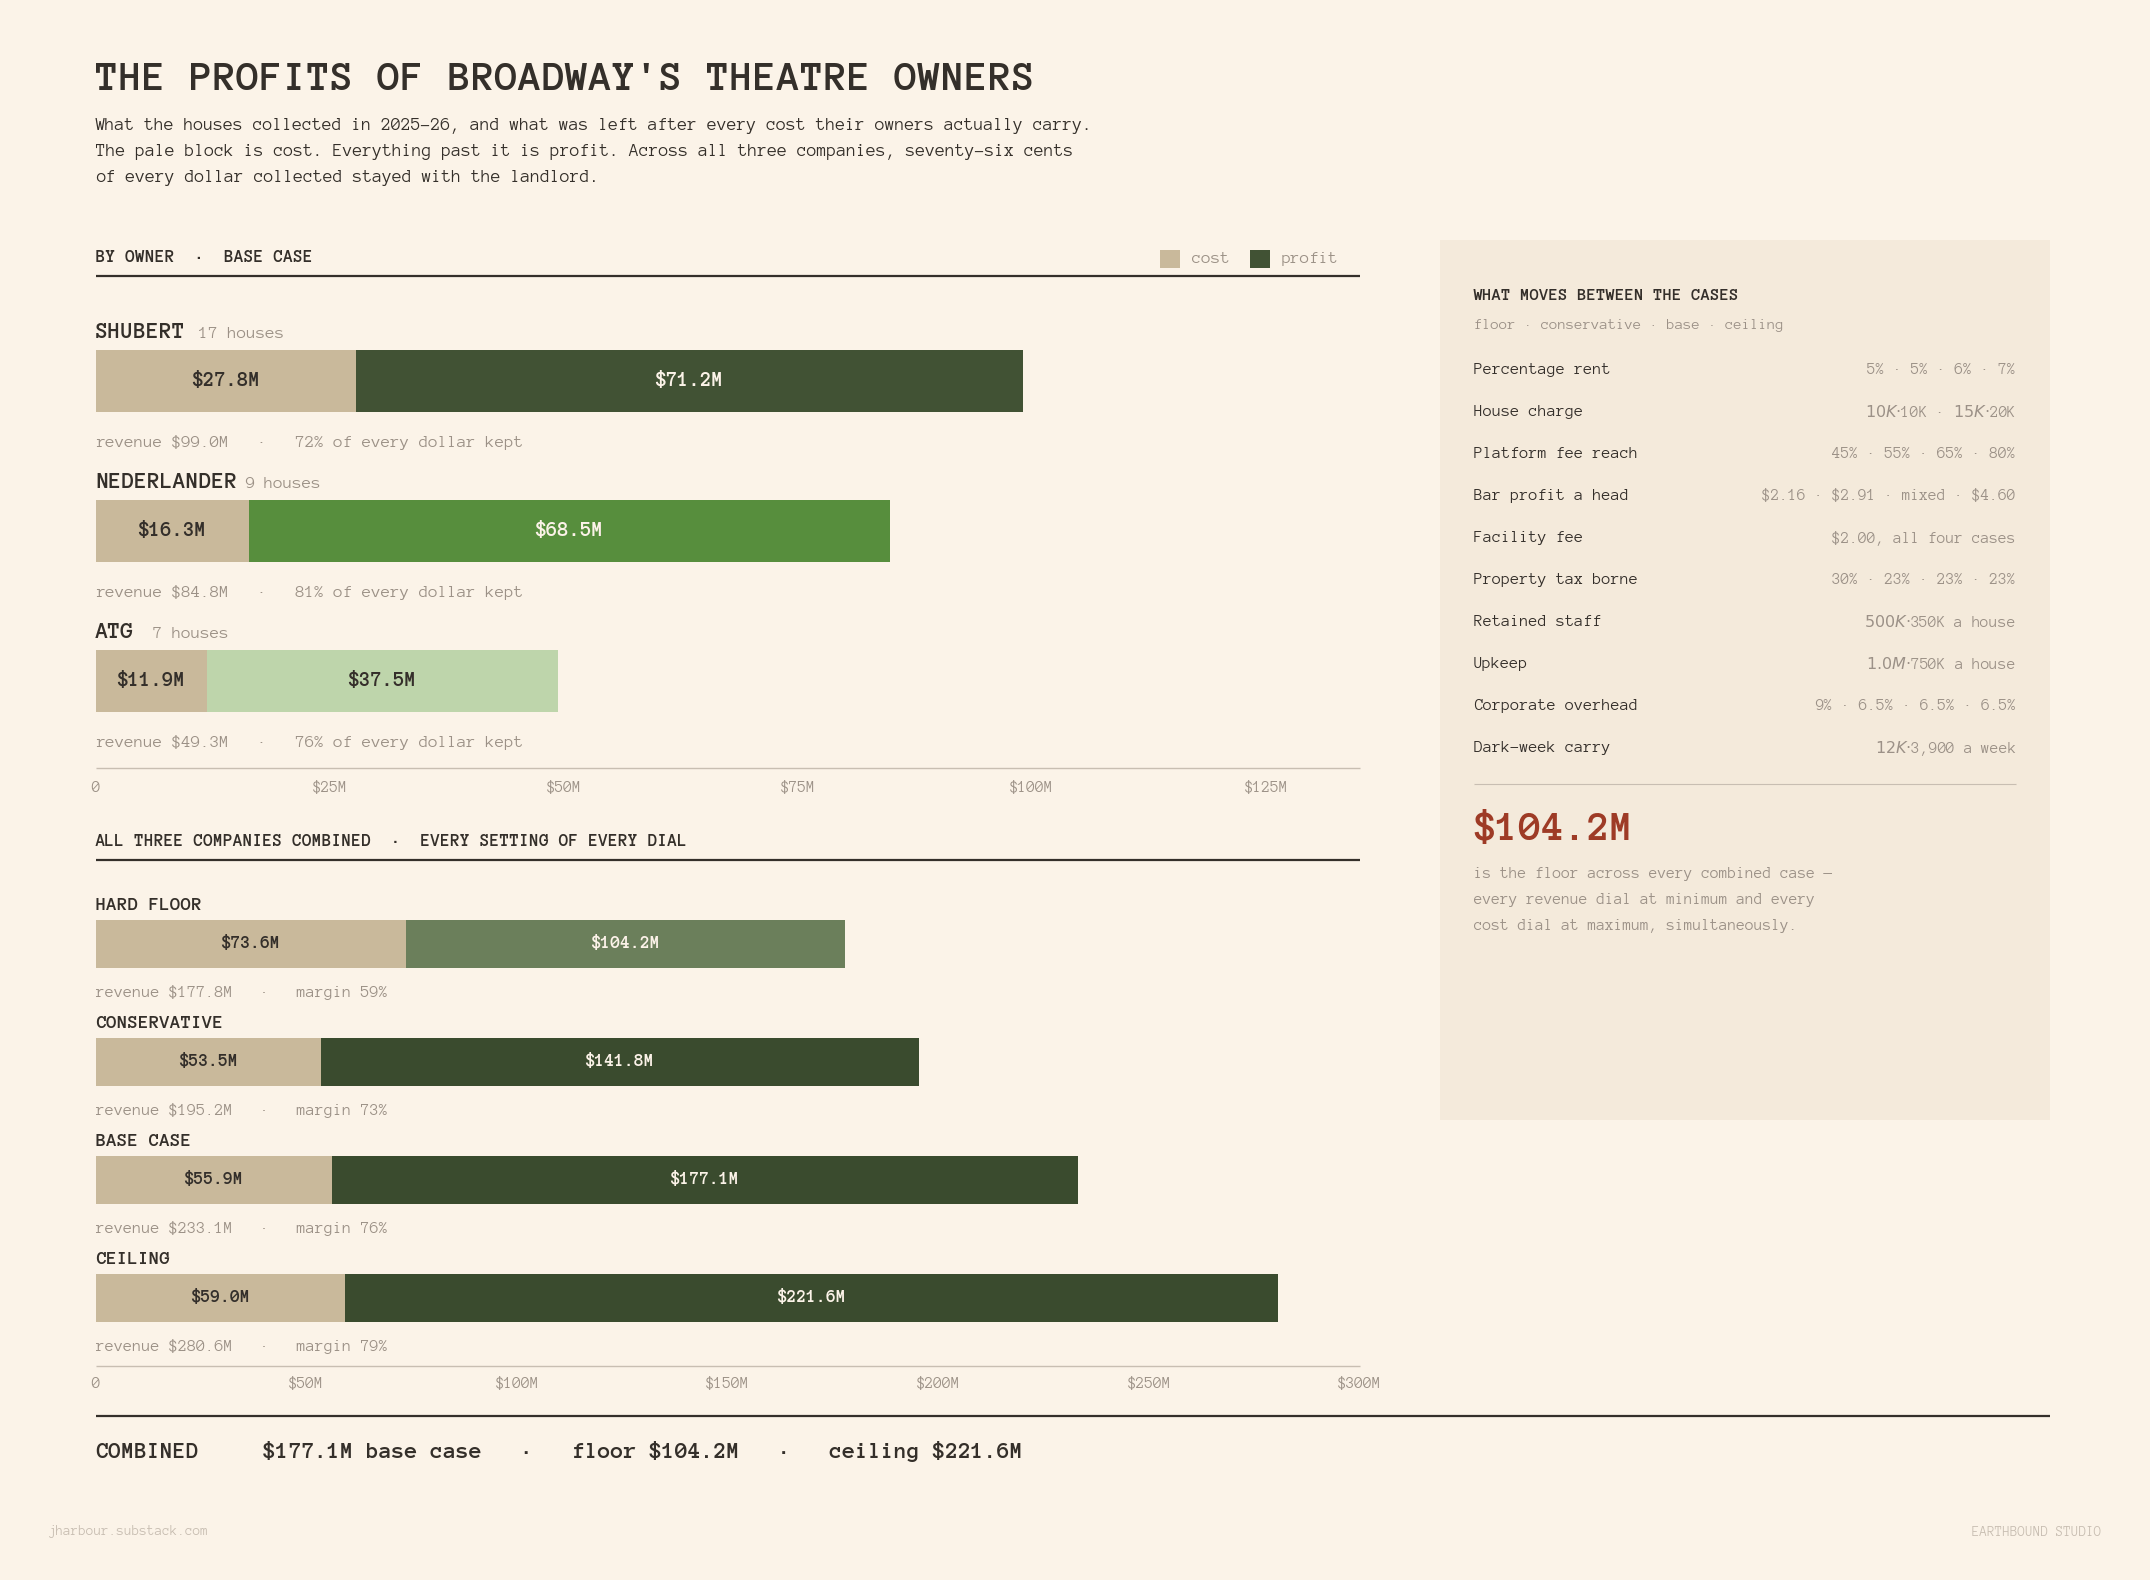
$177.1 million
Shubert $71.2M, Nederlander $68.5M, ATG $37.5M
THE ONE TIME SOMEBODY SHOWED THEIR WORK
When I took every parameter and pointed it at Jujamcyn’s five houses per the memo discussed in the intro, a funny number arose. My model calculated $18.2 million in profit. The filing says thirty-four…
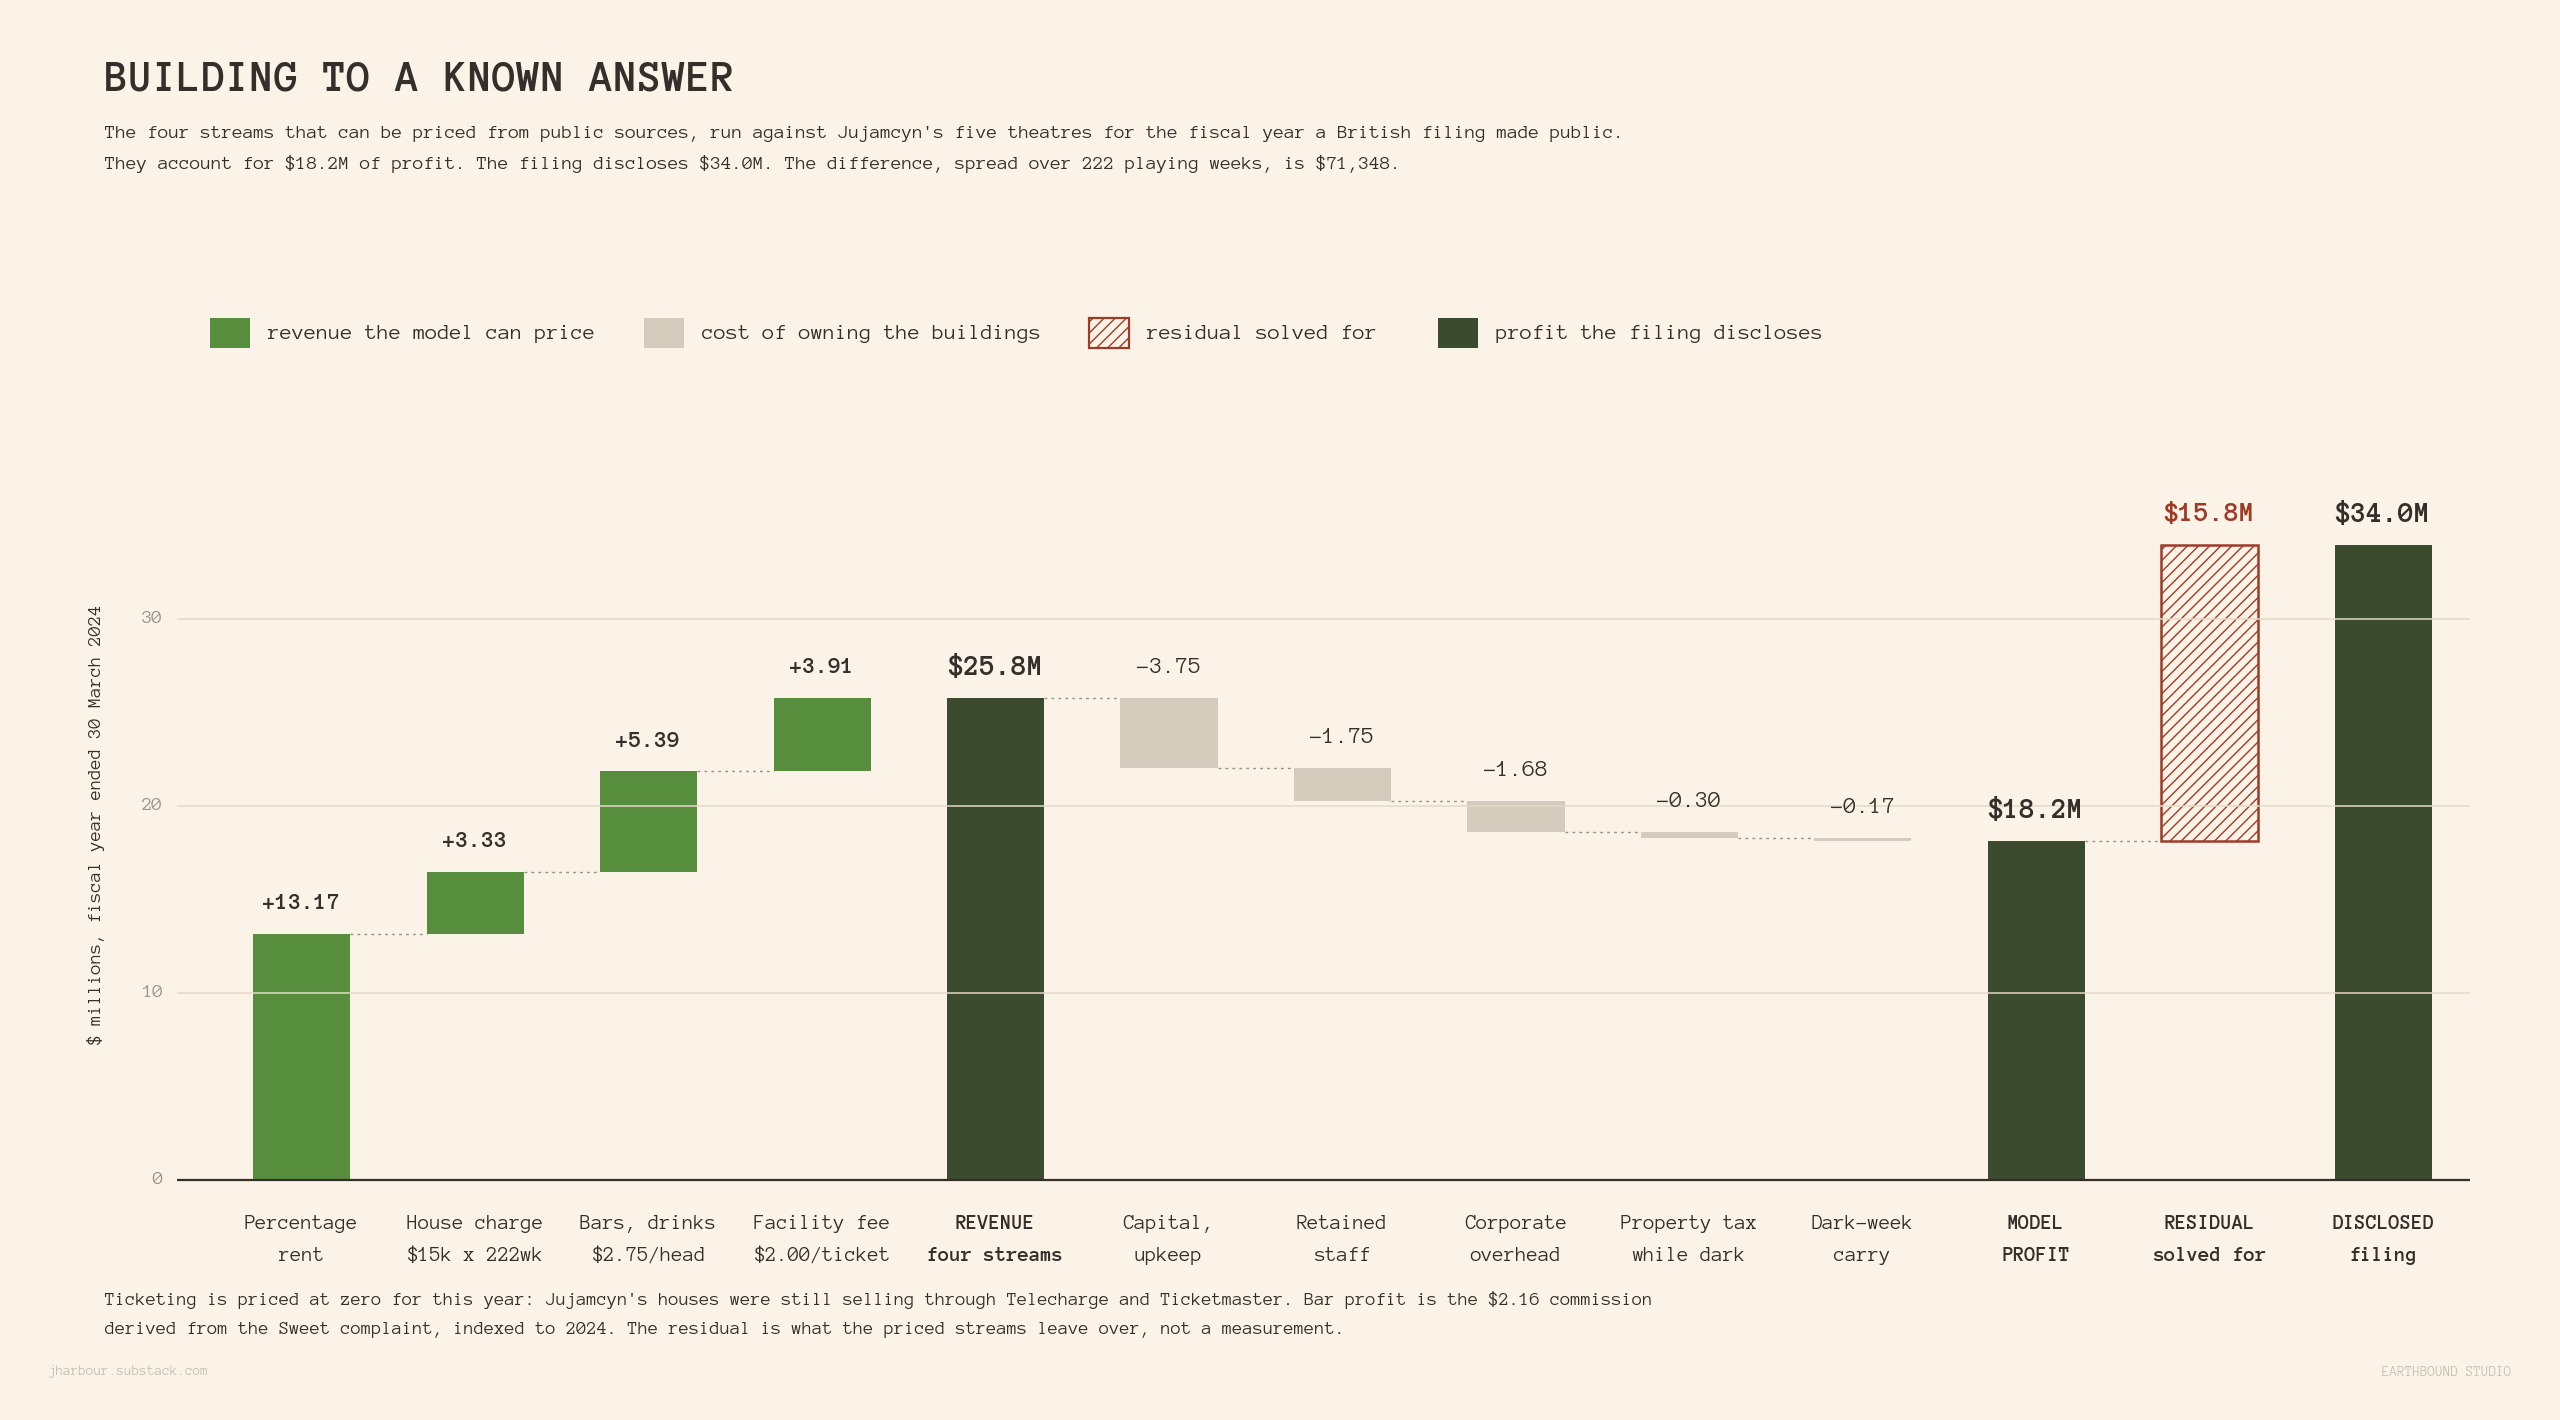
I captured about 54% of what Jujamcyn actually made. Either I fucked up pretty egregiously OR something else was happening.
Between the revenue Jujamcyn reported ($116M) and the revenue I found ($25.8M), there was a roughly $90M difference. An additional $400k for every week a show was in one of those buildings would have had to have been made to close that gap.
Remember the memo? Every item listed out is money the production hands the landlord as reimbursement; it all lands on the landlord’s books as revenue before leaving again as cost. Recall Gypsy at roughly $350,000 a week all-in; multiply by the 222 playing weeks in a Jujamcyn theater and you get $77.7 million, sitting right in the neighborhood of my hole. That’s a ceiling rather than a measurement — Gypsy‘s weekly nut includes cast, crew, marketing and royalties, and only a slice of it is reimbursement to the house — but the memo tells you the slice is large and the arithmetic tells you nothing else on the P&L is big enough to be doing this work.
Reimbursements pass straight through. But the memo, which can explain $116 million against $25.8 million, explains zero of $34.0 million against $18.2 million. A $15.8 million gap still sitting there.
Some potentialities for why that still exists:
Jordan Roth was a co-producer on shows like Moulin Rouge! and Hadestown, which played every week of that year with Jujamcyn credited on the title page; both properties generated $109.8 million of gross and both recouped well before the season opened. The true difficulty in estimating this, as mentioned above, is that I am not privy to the side letter agreements between Roth and those producers to know what terms he was given.
If the landlord bills the show $1.15 for every dollar it spends, that spread is straight profit. Against a $77 million reimbursement base, a 15% margin is $11 million. While I cannot prove any of this, it is incredibly easy to hit upcharged prices in “administrative” and “accounting” charges, sitting on that list with no defined basis whatsoever.
The premium and VIP income ATG names in its own investor-facing materials and that I count at zero.
Sadly, my comparison ends with a 54% capture rate. Either a real failure of my arithmetic or a real success at measuring something the disclosure was never built to show. I lean toward the second. I would, though, wouldn’t I? What I will say without hedging is this: none of the four candidates above is a reason the number should come down. If the model is wrong, it is wrong low.
The House
The colloquial name of the theater. The house charge, the house manager, the house was full. Semi-ironically, the industry articulated an arrangement on 45th Street where, much like a poker room, the house always wins. The players play against each other, and the house takes its rake off every pot before the chips move, indifferent to which player is bluffing and which goes home broke.
All it needs to succeed is… a tenant
Per the estimates above, an empty Broadway house costs $12,928 a week to the owner. Load in a share of the booking desk and the house engineer and it reaches $19,659.
But when the building is full, the tenant absorbs the ushers, the cleaners, the utilities, the exterminator, the tax bill. The gambler brings the chips, pays the dealer, and scrubs the floors, while the house pockets the jackpot simply for owning the land underneath the table.
Across the portfolio, there is a profit margin of seventy-six cents of every dollar collected. I ran that past a number of GMs and lead producers, people under the premonition that “this is just a futile attempt,” braced to be laughed out of the room. Instead, I was told that a profit margin of 76% was pretty accurate, with the actual profit number likely off, but only by a shallow amount. Several even made a point to let me know they thought 76% was conservative.
Return to my arugment in Fuck the Doomsayers. The misalignment of interests between the theater owners and producers takes on a more nuanced stanced. The landlord isn’t afraid of the dark. He just prefers the light.
A deep asymmetry is revealed when we investigate what he is actually buying at that table when both parties sit down across from the unions. The producer needs the show to clear its capitalization. The landlord needs the room occupied, and those are different objectives that happen to rhyme. Every dollar the unions win comes out of the weekly nut, which raises the number a show must gross to survive, which shortens runs and empties buildings… eventually. But eventually is not a clock. What fills a building next season is the queue outside, forty-odd titles deep, indifferent to what a musician costs. So he concedes, because the cost lands on somebody else’s ledger and the applicants keep applying.
Wankel’s answer, I suspect, would be that occupancy is alignment. He earns when your show runs, so he wants it to run, so you want the same thing. But Mr. Wankel, you are paid weekly, sir. From the first dollar. You are also paid at the end, out of whatever clears your capitalization. Every week the lights are on settles your account and does nothing for mine until a threshold I will never meet is met. Same race, two different finish lines.
Mr. Wankel, if I may, you are never choosing between a mediocre tenant and an empty house. You are choosing among applicants, and you can hold the room for months at thirteen thousand a week while you decide. That isn’t traditional supply-demand economics finding a price. A queue that long means the price never clears, and the room gets rationed by something other than money. Allocations reward what allocations have always rewarded, which is standing with the person doing the allocating. The producer who has filled three of your houses profitably gets the call. The first-timer with the better show waits, or takes the wrong-sized room, or (as I have been advocating to many) FINALLY REALIZES THAT BROADWAY IS NOT THE ONLY DEFINITION OF SUCCESS IN THEATER.
You might look at the 2003 musicians’ strike and see a landlord terrified of an empty room. Eighteen shows dark, the employer bloc folded in four days, case closed. But what broke wasn’t carry cost, which across all three companies would have run ~$427,000 a week against a portfolio clearing $177 million. What broke was Bloomberg hauling everyone to Gracie Mansion after the city priced the loss at ten million in a single weekend. They folded when an outside party made vacancy expensive. Absent a mayor, it isn’t.
I still believe my proposal regarding changing the percentage rent to a breakpoint threshold is right about fairness, however, it was wrong about consequences. A breakpoint lowers the value of the marginal tenancy. Make the mediocre tenant cheaper while the empty room stays free and you just get a pickier landlord with a longer waiting list.
But, as I’ve been shouting from the rooftops, the leverage sits with the money.
A producer can’t refuse these terms. He needs the room and the man offering has a waiting list and no clock. But its the investors whose capital is at risk, and an investor can refuse anything. They just never do, because nobody has shown them what they’d be refusing.
The Theatrical Syndication Financing Act requires every Broadway offering to file with the Attorney General’s Investor Protection Bureau before it can accept a dollar. The Part 50 regulations underneath it give the Attorney General authority over what the offering circular has to say and which underlying documents come in with it. That authority already gets exercised. It just isn’t pointed at the theatre.
Point it there.
Require every offering to disclose the license terms between the producers and the landlord. And most importantly, whether the company that owns the building holds a producing interest in the show it’s renting to. A first-time investor in a Broadway musical currently has no way to learn that the room came with a partner attached, or that the production competing for it didn’t. He finds out the way I did, by reading a British filing and a concessions lawsuit eighteen months after the money is gone.
An empty theatre stays cheap under this. But the arithmetic lands in front of the only people who can decline to fund it, and money is the one thing that has ever made any substantive change on this street.
Some producers have told me it really runs between $40,000 to $60,000. But that gap, call it $25,000 to $45,000, is in theater reimbursements. HVAC. Insurance. The non-personnel operating costs of the building, billed back to the show. In commercial leasing this is known as additional rent, or the tenant’s share of operating expenses, legally distinct from base rent even though it lands in the same envelope on the same day and feels identical to the person paying it.
When the rate is @10k: $13.7M; $20k: $27.4M
Divide by the 47.5% commission.
Two flags: (1) The 47.5% rate is documented from February 2015 forward; the 2010–2015 arrangement isn’t in the record, but I’m assuming it remained consistent. And the $50 million includes catering and coupon commissions, not just the bar, pushing the derived basket slightly high.
241.0 in 2016, 325.25 this January
One piece of advice, free of charge, no pun intended: walk up to the actual box office window. Nobody there charges you a service fee. It’s the single best-kept secret on this entire street, and I’m telling you for nothing, which is more than Ticketmaster has ever done for anyone.
Gershwin (owned by the Paramount Group, houses Wicked), Marquis (Vornado Realty Trust, housing Stranger Things), Minskoff (SL Green, houses The Lion King), Hudson (Millennium & Copthorne Hotels, housed Every Brilliant Thing), Lyric (New York City government, houses Harry Potter and the Cursed Child).
For 2024: Realty Income 3.4% of revenue, NNN REIT 5.1%, Agree Realty 6.0%, W. P. Carey 6.3%, EPR Properties 7.2%, Vornado 8.3%, Paramount Group 8.8%.
The seven REITs report revenue including tenant reimbursements, which my $233.1 million excludes, and none of them can bill their back office to tenants the way a Broadway landlord bills it under two line items with the word “charges.” Applying their 6.5% to my smaller base is really the more conservative estimate that exists.
One post covering nights and weekends, 84 hours at the $30 an hour a licensed guard company charges in Manhattan, is $2,520. Add the $740 of metered electricity above, heat at freeze-protection levels. It annualizes to about $215 a week and runs closer to $500 in January, and the standing items that never ask whether anyone is inside — the standpipe checks and the elevator inspection and the exterminator and the snow — at maybe another $400.
Get this Mamdani!
I'm not in the theater world enough to read all of this, but what I read once again was an impressive amount of work!